Advertisements
Advertisements
प्रश्न
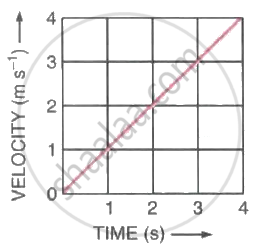
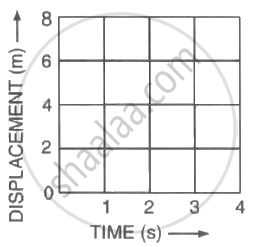
Figure (a) shows the velocity-time graph for the motion of a body. Use it to find the displacement of the body at t = 1 s, 2 s, 3 s and 4 s, then draw on Figure (b), the displacement-time graph for it.
 |
 |
| (a) | (b) |
उत्तर
Let displacements at t = 1 s, 2 s, 3 s, 4 s be S1, S2, S3, S4 respectively.
At t = 1 s, displacement S1 = `1/2 xx 1 xx 1` = 0.5 m
At t = 2 s, displacement S2 = `1/2 xx 2 xx 2` = 2 m
At t = 3 s, displacement S3 = `1/2 xx 3 xx 3` = 4.5 m
At t = 4 s, displacement S4 = `1/2 xx 4 xx 4` = 8 m
The table below gives the displacement of body at different instants.
| Time (in s) | 1 | 2 | 3 | 4 |
| Displacement (in m) | 0.5 | 2 | 4.5 | 8 |
The displacement time graph is shown below

APPEARS IN
संबंधित प्रश्न
State how the velocity-time graph can be used to find The distance travelled by the body in a given time
Draw a velocity-time graph for a body moving with an initial velocity u and uniform acceleration a. Use this graph to find the distance travelled by the body in time t.
Figure given below shows a velocity-time graph for a car starting from rest. The graph has three parts AB, BC and CD.

Compare the distance travelled in part BC with the distance travelled in part AB.
A ball moves on a smooth floor in a straight line with uniform velocity 10 m s-1 for 6 s. At t = 6 s, the ball hits a wall and comes back along the same line to the starting point with the same speed. Draw the velocity-time graph and use it to find the total distance travelled by the ball and its displacement.
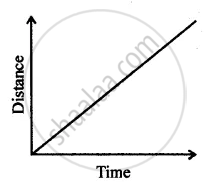
Can you suggest the kind of motion of a body from the following distance – time graph?
The table below shows the distance travelled by two vehicles A and B during each second:
| Time (s) | 0 | 1 | 2 | 3 | 4 | 5 | 6 | 7 |
| Distance travelled by A (m) | 0 | 20 | 80 | 180 | 240 | 300 | 360 | 420 |
| Distance travelled by B (m) | 0 | 10 | 40 | 90 | 160 | 250 | 360 | 490 |
Which vehicle is moving with uniform velocity?
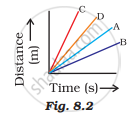
Four cars A, B, C, and D are moving on a levelled road. Their distance versus time graphs are shown in Fig. 8.2. Choose the correct statement.
Give some examples for vector quantity.
A particle is moving in a circular pattern of radius r. The displacement after half a circle would be ______.
The rate of change of displacement ______.
