Advertisements
Advertisements
प्रश्न
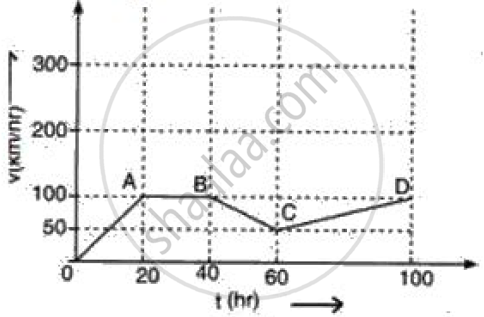
The figure represents graphically the velocity of a car moving along a straight road over a period of 100 hours.
Calculate the distance travelled in the last 40 h.
उत्तर

Distance travelled in last 40 hour would be equal to area under graph during that time = 50 x (100 - 60) + `1/2`x(100 - 60) x(100 - 50).
S = 2000 + 1000 = 3000 km.
APPEARS IN
संबंधित प्रश्न
A body at rest is made to fall from the top of a tower. Its displacement at different instants is given in the following table:
| Time (in s) | 0.1 | 0.2 | 0.3 | 0.4 | 0.5 | 0.6 |
| Displacement (in m) | 0.05 | 0.20 | 0.45 | 0.80 | 1.25 | 1.80 |
Draw a displacement-time graph and state whether the motion is uniform or non-uniform?
How can you find the following?
Displacement from velocity – time graph.
Show the difference between distance and displacement with the help of a diagram.
A body is moving along a circular path of radius r. What will be the distance and displacement of the body when it completes:
Half a revolution
A particle moves along a circular path. How many times does it change its direction in two complete rounds?
Distinguish distance and displacement.
The SI unit of displacement is ______.
Write a note on the following:
knot
Choose the correct option.
Distance travelled by a freely falling body is proportional to ______.
