Advertisements
Advertisements
प्रश्न
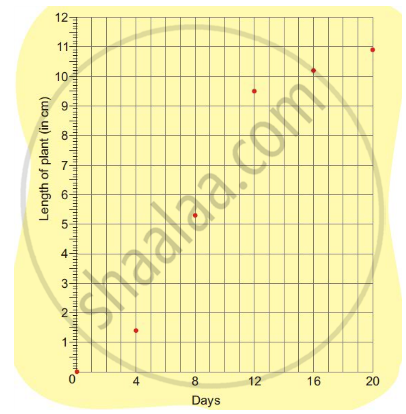
Find out from the growth chart

- What could be the length of this plant on the 14th day? Guess.
विकल्प
8.7 cm
9.9 cm
10.2 cm
10.5 cm
उत्तर
9.9 cm
APPEARS IN
संबंधित प्रश्न
Use the tables below to draw linear graphs.
Population (in thousands) of men and women in a village in different years.
| Year | 2003 | 2004 | 2005 | 2006 | 2007 |
| Number of men | 12 | 12.5 | 13 | 13.2 | 13.5 |
| Number of women | 11.3 | 11.9 | 13 | 13.6 | 12.8 |
The following table shows the number of patients discharged from a hospital with HIV diagnosis in different years:
| Years: | 2002 | 2003 | 2004 | 2005 | 2006 |
| Number of patients: | 150 | 170 | 195 | 225 | 230 |
Represent this information by a graph.
The following table shows the sales of a commodity during the years 2000 to 2006.
| Years: | 2000 | 2001 | 2002 | 2003 | 2004 | 2005 | 2006 |
| Sales (in lakhs of Rs): | 1.5 | 1.8 | 2.4 | 3.2 | 5.4 | 7.8 | 8.6 |
Draw a graph of this information.
Draw the temperature-time graph in each of the following cases:
| Time (in hours): | 7:00 | 9:00 | 11:00 | 13:00 | 15:00 | 17:00 | 19:00 | 21:00 |
| Temperature (°F) in: | 100 | 101 | 104 | 102 | 100 | 99 | 100 | 98 |

Find out from the growth chart

- Will the plant keep growing all the time? What will be its length on the 100th day? Make a guess!
Which graphs of the following represent the table below?
| Length of Side of a Square | 1 | 2 | 3 | 4 | 5 |
| Perimeter | 4 | 8 | 12 | 16 | 20 |
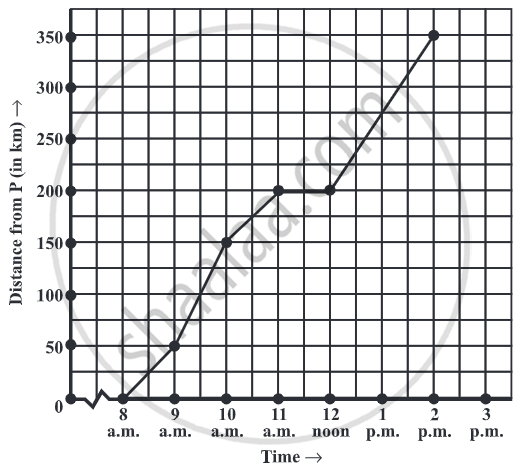
Study the given graph and complete the corresponding table below.

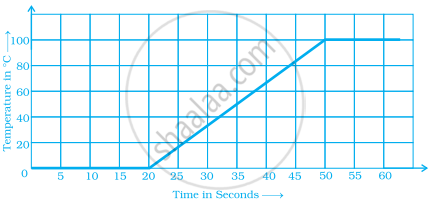
The following graph shows the change in temperature of a block of ice when heated. Use the graph to answer the following questions:
- For how many seconds did the ice block have no change in temperature?
- For how long was there a change in temperature?
- After how many seconds of heating did the temperature become constant at 0°C?
- What was the temperature after 25 seconds?
- What will be the temperature after 1.5 minutes? Justify your answer.

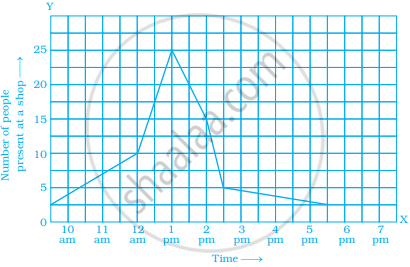
The following graph shows the number of people present at a certain shop at different times. Observe the graph and answer the following questions.

- What type of a graph is this?
- What information does the graph give?
- What is the busiest time of day at the shop?
- How many people enter the shop when it opens?
- About how many people are there in the shop at 1:30 pm?
