Advertisements
Advertisements
प्रश्न
For the following table, draw a bar-graph
| A | B | C | D | E | F |
| 230 | 400 | 350 | 200 | 380 | 160 |
उत्तर

APPEARS IN
संबंधित प्रश्न
The following table gives the distribution of students of two sections according to the mark obtained by them:-
| Section A | Section B | ||
| Marks | Frequency | Marks | Frequency |
| 0 - 10 | 3 | 0 - 10 | 5 |
| 10 - 20 | 9 | 10 - 20 | 19 |
| 20 - 30 | 17 | 20 - 30 | 15 |
| 30 - 40 | 12 | 30 - 40 | 10 |
| 40 - 50 | 9 | 40 - 50 | 1 |
Represent the marks of the students of both the sections on the same graph by two frequency polygons. From the two polygons compare the performance of the two sections.
The runs scored by two teams A and B on the first 60 balls in a cricket match are given below:
| Number of balls | Team A | Team B |
| 1 - 6 | 2 | 5 |
| 7 - 12 | 1 | 6 |
| 13 - 18 | 8 | 2 |
| 19 - 24 | 9 | 10 |
| 25 - 30 | 4 | 5 |
| 31 - 36 | 5 | 6 |
| 37 - 42 | 6 | 3 |
| 43 - 48 | 10 | 4 |
| 49 - 54 | 6 | 8 |
| 55 - 60 | 2 | 10 |
Represent the data of both the teams on the same graph by frequency polygons.
[Hint: First make the class intervals continuous.]
Explain the reading and interpretation of bar graphs.
The following table shows the daily production of T. V. sets in an industry for 7 days of a week:
| Day | Mon | Tue | Wed | Thurs | Fri | Sat | Sun |
| Number of T.V. Sets | 300 | 400 | 150 | 250 | 100 | 350 | 200 |
Represent the above information by a pictograph .
The following data gives the value (in crores of rupees) of the Indian export of cotton textiles for different years:
| Years | 1982 | 1983-1984 | 1984-1985 | 1985-1986 | 1986-1987 |
| Value of Export of Cotton Textiles (in crores of rupees) |
300 | 325 | 475 | 450 | 550 |
Represent the above data with the help of a bar graph. Indicate with the help of a bar graph the year in which the rate of increase in exports is maximum over the preceding year.
The following tables gives the quantity of goods (in crore tonnes)
| Year | 1950-51 | 1960-61 | 1965-66 | 1970-71 | 1980-81 | 1982-83 |
| Quantity of Goods (in crore tonnes) |
9 | 16 | 20 | 20 | 22 | 26 |
Explain through the bar graph if the quantity of goods carried by the Indian Railways in 1965-66 is more than double the quantity of goods carried in the year 1950-51.
Draw a histogram for the daily earnings of 30 drug stores in the following table:
| Daily earning (in Rs): |
450-500 | 500-550 | 550-600 | 600-650 | 650-700 |
| Number of Stores: | 16 | 10 | 7 | 3 | 1 |
The daily wages in a factory are distributed as follows:
|
Daily wages (in Rs.) |
125 - 175 |
175 - 225 |
225 - 275 |
275 - 325 |
325 - 375 |
|
Number of workers |
4 |
20 |
22 |
10 |
6 |
Draw a frequency polygon for this distribution.
The following tables show the mode of transport used by boys and girls for going to the same school.
| Bus | Bicycle | Walking | Other sources | |
|
Number of boys |
80 | 60 | 20 | 85 |
|
Number of girls |
90 | 75 | 35 | 60 |
Draw a double bar graph representing the above data.
The frequency distribution has been represented graphically as follows:
| Marks | 0 – 20 | 20 – 40 | 40 – 60 | 60 – 100 |
| Number of Students | 10 | 15 | 20 | 25 |
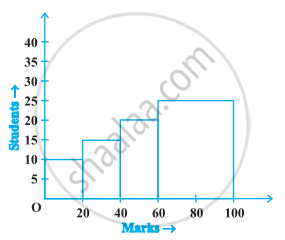
Do you think this representation is correct? Why?
