Advertisements
Advertisements
प्रश्न
Identify the following data can be represented in a histogram?
The number of votes polled from 7 am to 6 pm in an election
विकल्प
Yes
No
उत्तर
The number of votes polled from 7 am to 6 pm in an election - Yes
APPEARS IN
संबंधित प्रश्न
In the following table, the investment made by 210 families is shown. Present it in the form of a histogram.
|
Investment
(Thousand Rupees) |
10 - 15 | 15 - 20 | 20 - 25 | 25 - 30 | 30 - 35 |
| No. of families | 30 | 50 | 60 | 55 | 15 |
Draw a histogram to represent the following data:
| Monthly salary (in Rs) | Number of teachers |
| 5600−5700 | 8 |
| 5700−5800 | 4 |
| 5800−5900 | 3 |
| 5900−6000 | 5 |
| 6000−6100 | 2 |
| 6100−6200 | 3 |
| 6200−6300 | 1 |
| 6300−6400 | 2 |
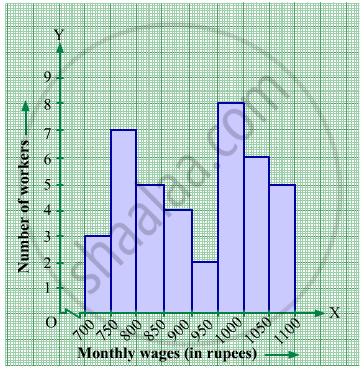
The following histogram shows the monthly wages (in Rs) of workers in a factory:
(i) In which wage-group the largest number of workers are being kept? What is their number?
(ii) What wages are the least number of workers getting? What is the number of such workers?
(iii) What is the total number of workers?
(iv) What is the factory size?
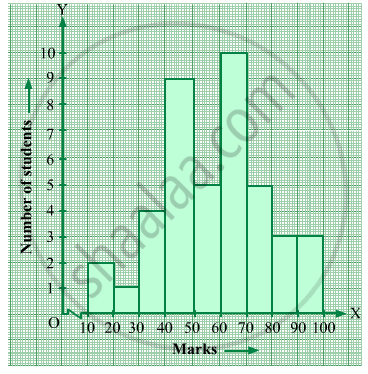
Below is the histogram depicting marks obtained by 43 students of a class:
(i) Write the number of students getting the highest marks.
(ii) What is the class size?
The following frequency distribution table shows marks obtained by 180 students in Mathematics examination.
| Marks | No. of students |
| 0 – 10 | 25 |
| 10 – 20 | x |
| 20 – 30 | 30 |
| 30 – 40 | 2x |
| 40 – 50 | 65 |
Find the value of x. Also draw a histogram representing the above information.
Construct a frequency polygon without using a histogram for the following frequency distribution :
| Class Interval | 1-10 | 11-20 | 21-30 | 31-40 | 41-50 |
| Frequency | 8 | 12 | 10 | 16 | 6 |
Identify the following data can be represented in a histogram?
The number of students in each class of a school
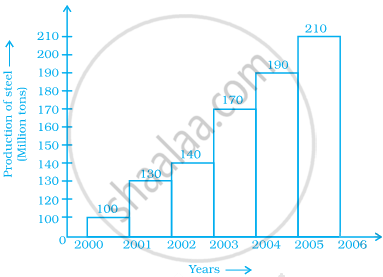
The following pictorial representation of data is a histogram.

The following histogram shows the frequency distribution of teaching experiences of 30 teachers in various schools:

- What is the class width?
- How many teachers are having the maximum teaching experience and how many have the least teaching experience?
- How many teachers have teaching experience of 10 to 20 years?
Use graph paper for this question. Estimate the mode of the given distribution by plotting a histogram. [Take 2 cm = 10 marks along one axis and 2 cm = 5 students along the other axis]
| Daily wages (in ₹) | 30 - 40 | 40 - 50 | 50 - 60 | 60 - 70 | 70 - 80 |
| No. of Workers | 6 | 12 | 20 | 15 | 9 |
