Advertisements
Advertisements
प्रश्न
If we denote speed by S, the distance by D and time by T, the relationship between these quantities is
विकल्प
S = D × T
T = `"S"/"D"`
S = `1/"T" xx "D"`
S = `"T"/"D"`
उत्तर
S = `1/"T" xx "D"`
APPEARS IN
संबंधित प्रश्न
What can you say about the motion of an object whose distance-time graph is a straight line parallel to the time axis?
The speed-time graph for a car is shown in the following figure:
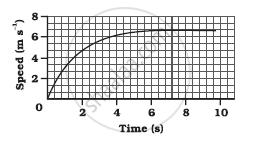
- Find how far the car travels in the first 4 seconds. Shade the area on the graph that represents the distance travelled by the car during the period.
- Which part of the graph represents uniform motion of the car?
The graph given alongside shows the positions of a body at different times. Calculate the speed of the body as it moves from :
(1) A to B,
(2) B to C, and
(3) C to D.

Four cars A, B, C and D are moving on a levelled, straight road. Their distance-time graphs are shown in the given figure. Which of the following is the correct statement regarding the motion of these cars?
Figure (a) shows the displacement-time graph for the motion of a body. Use it to calculate the velocity of the body at t = 1 s, 2 s and 3 s, and then draw the velocity-time graph in Figure (b) for it.
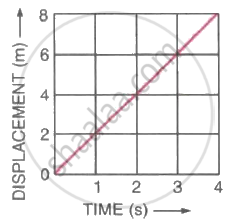 |
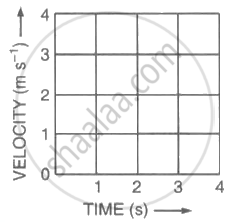 |
| (a) | (b) |
Show the shape of the distance – time graph for the motion in the following cases.
- A bus moving with a constant speed.
- A car parked on a road side.
What are the uses of the graphical study of motion?
Two students were asked to plot a distance-time graph for the motion described in Table A and Table B.
Table A
| Distance moved (m) | 0 | 10 | 20 | 30 | 40 | 50 |
| Time (minutes) | 0 | 2 | 4 | 6 | 8 | 10 |
Table B
| Distance moved (m) | 0 | 5 | 10 | 15 | 20 | 25 |
| Time (minutes) | 0 | 1 | 2 | 3 | 4 | 5 |
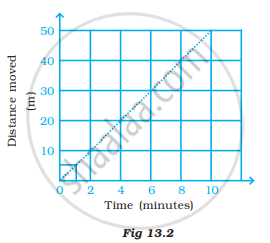
The graph given in Figure 13.2 is true for
Complete the data of the table given below with the help of the distance-time graph given in Figure 13.6
| Distance (m) | 0 | 4 | ? | 12 | ? | 20 |
| Time (s) | 0 | 2 | 4 | ? | 8 | 10 |

The distance between Bholu’s and Golu’s house is 9 km. Bholu has to attend Golu’s birthday party at 7 o’clock. He started from his home at 6 o’clock on his bicycle and covered a distance of 6 km in 40 minutes. At that point, he met Chintu and spoke to him for 5 minutes and reached Golu’s birthday party at 7 o’clock. With what speed did he cover the second part of the journey? Calculate his average speed for the entire journey.
