Advertisements
Advertisements
प्रश्न
The speed-time graph for a car is shown in the following figure:
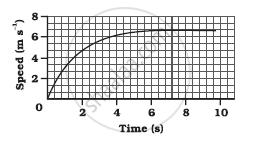
- Find how far the car travels in the first 4 seconds. Shade the area on the graph that represents the distance travelled by the car during the period.
- Which part of the graph represents uniform motion of the car?
उत्तर
The motion during the first 4 seconds is not uniformly accelerated. So, the distance travelled by car in the first 4 seconds is calculated using the graphical method.
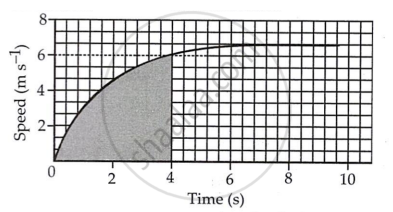
(a) number of squares in the shaded part of the graph is 320.5
One small square m x-axis represents, `t = 2/5 s`
One small square on y axis represents.
`v = 2/3 ms^-1`
∴ area of each square, `v xx t`
= `2/3 xx 2/3`
= `4/15 m`
Total area = `61.5 × 4/15`
= 16.4 m
(b) The limiting flat portion of the curve describes the constant speed of the car, i.e., a speed of 6.0 m s-1. At this stage, the acceleration of the car is zero.
Therefore, a portion of the graph between t = 6 s to 10 s, describes the uniform motion of the car.
APPEARS IN
संबंधित प्रश्न
What is the nature of the distance-time graphs for uniform and non-uniform motion of an object?
A driver of a car travelling at 52 km h−1 applies the brakes and accelerates uniformly in the opposite direction. The car stops in 5 s. Another driver going at 3 km h−1 in another car applies his brakes slowly and stops in 10 s. On the same graph paper, plot the speed versus time graphs for the two cars. Which of the two cars travelled farther after the brakes were applied?
What does the slope of a distance-time graph indicate ?
Fill in the following blank with suitable word :
The slope of a distance-time graph indicates ………………….. of a moving body.
A spaceship is moving in space with a velocity of 60 kms−1. It fires its retro engines for 20 seconds and velocity is reduced to 55 kms−1. Calculate the distance travelled by a spaceship in 40 s, from the time of firing of the retro- rockets.
The slope of the distance-time graph at any point gives______.
Two students were asked to plot a distance-time graph for the motion described in Table A and Table B.
Table A
| Distance moved (m) | 0 | 10 | 20 | 30 | 40 | 50 |
| Time (minutes) | 0 | 2 | 4 | 6 | 8 | 10 |
Table B
| Distance moved (m) | 0 | 5 | 10 | 15 | 20 | 25 |
| Time (minutes) | 0 | 1 | 2 | 3 | 4 | 5 |
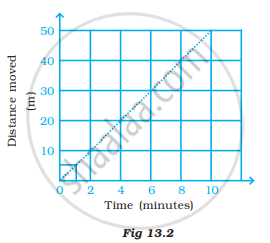
The graph given in Figure 13.2 is true for
If we denote speed by S, the distance by D and time by T, the relationship between these quantities is
Boojho goes to the football ground to play football. The distance-time graph of his journey from his home to the ground is given in Figure 13.9.
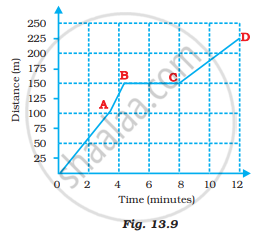
(a) What does the graph between points B and C indicate about the motion of Boojho?
(b) Is the motion between 0 to 4 minutes uniform or nonuniform?
(c) What is his speed between 8 and 12 minutes of his journey?
The slope of the distance-time curve is steeper/greater is the ______.
