Advertisements
Advertisements
प्रश्न
Observe the graph and select the correct option:
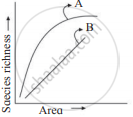
विकल्प
Line A represents, S = CA2
Line B represents, log C = log A + Z log S
Line A represents, S = CAZ
Line B represents, log S = log Z + C log A
उत्तर
Line A represents, S = CAZ
Explanation:
The equation S = CAZ often gives the species-area relationship, where S is the number of species, A is the area, and C and Z are constants. The relationship is typically nonlinear.
संबंधित प्रश्न
The following graph shows the species - area relationship. Answer the following questions as directed.

(a) Name the naturalist who studied the kind of relationship shown in the graph. Write the observations made by him.
(b) Write the situations as discovered by the ecologists when the value of 'Z'
(Slope of the line) lies between.
(i) 0.1 and 0.2
(ii) 0.6 and 1.2
What does 'Z' stand for?
(c) When would the slope of the line 'b' become steeper?
Maximum species richness is observed in the ______.
With reference to graph select the correct alternative
Which of the following is an observation of Alexander von Humboldt's documented pattern in ecology?
"Species richness increased with increased explored area but only a limit". This statement was given by.
Which of the following countries has the highest biodiversity?
Given below is an equation describing the Species-Area relationship between species richness and area for a wide variety of taxa as angiosperm plants, birds, bats etc. S = CAz
- Give a graphical representation of the given equation showing Species-Area relationship.
- What does 'S' represent in the given equation?
- What is the value of 'Z' (regression coefficient) for frugivorous birds and mammals in the tropical forests of different continents?
Write the inference drawn by Alexander von Humboldt after his extensive explorations of South American jungle.
Which of the following hypothesis suggests that ecosystems are like aeroplanes where flight safety (ecosystem functioning) may or may not be compromised, depending upon which species are being lost?
Rivet Popper Hypothesis is an analogy to explain the significance of ______.
