Advertisements
Advertisements
प्रश्न
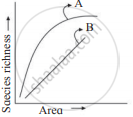
Observe the graph and select the correct option:
पर्याय
Line A represents, S = CA2
Line B represents, log C = log A + Z log S
Line A represents, S = CAZ
Line B represents, log S = log Z + C log A
उत्तर
Line A represents, S = CAZ
Explanation:
The equation S = CAZ often gives the species-area relationship, where S is the number of species, A is the area, and C and Z are constants. The relationship is typically nonlinear.
संबंधित प्रश्न
The following graph shows the species - area relationship. Answer the following questions as directed.

(a) Name the naturalist who studied the kind of relationship shown in the graph. Write the observations made by him.
(b) Write the situations as discovered by the ecologists when the value of 'Z'
(Slope of the line) lies between.
(i) 0.1 and 0.2
(ii) 0.6 and 1.2
What does 'Z' stand for?
(c) When would the slope of the line 'b' become steeper?
Short answer type question
Tropical regions exhibit species richness as compared to polar regions. Justify.
The 'rivet' in the rivet popper hypothesis is considered to represent the ______.
Which of the following hypothesis states: Rich species diversity leads to lesser variation in biomass production over a period of time.
In the equation: log S = log C + Z log A , S= species richness; Z = slope of line (regression coefficient); A = area; C = Y intercept. For smaller area, the value of Z ranges from ____________.
The graph of species richness and area for a number of taxa like angiospermic plants, freshwater fishes, and birds is found to be ______.
Amongst the animal groups given below, which one appears to be more vulnerable to extinction?
The species-area relationship is represented on a log scale as ______.
The relation between species richness and area for a wide variety of taxa appears as ______.
Alexander von Humboldt observed that, within a region species richness ______ with increasing explored area.
