Advertisements
Advertisements
प्रश्न
A square loop MNOP of side 20 cm is placed horizontally in a uniform magnetic field acting vertically downwards as shown in the figure. The loop is pulled with a constant velocity of 20 cm s−1 till it goes out of the field.
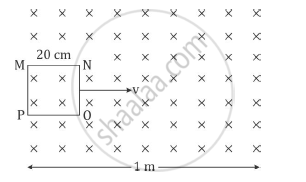
(i) Depict the direction of the induced current in the loop as it goes out of the field. For how long would the current in the loop persist?
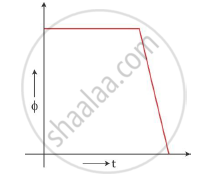
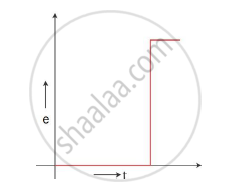
(ii) Plot a graph showing the variation of magnetic flux and induced emf as a function of time.
उत्तर
(i)The direction of induced current in the loop as it goes out is depicted in the figure below.
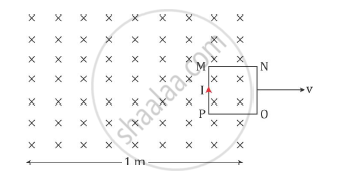
The current will persist till the entire loop comes out of the field. Hence, we have
`t=d/v=(20 cm)/(20 `
Hence, the current will persist for 1 second.
(ii)The magnetic flux in the coil when it is inside the field is constant. This maximum flux is given as Φ = Bla (a is the side of the square loop). This flux will start dropping once the loop comes out of the field and will be zero when it is completely out of the field.
The e.m.f. induced in the coil when it is inside the field is zero as the flux is not changing. When the loop just comes out of the field, the flux change is maximum and the e.m.f. induced is `e=(dphi)/dt=-Bl(db)/(dt)=-Blv` This e.m.f remains constant till the entire loop comes out. When the loop is completely out of the field, the e.m.f. drops to zero again.
APPEARS IN
संबंधित प्रश्न
A rectangular coil having 60 turns and area of 0.4m2 is held at right angles to a uniform magnetic field of flux density 5 × 10⁻⁵T. Calculate the magnetic flux passing through it.
A metallic loop is placed in a nonuniform magnetic field. Will an emf be induced in the loop?
An inductor is connected to a battery through a switch. Explain why the emf induced in the inductor is much larger when the switch is opened as compared to the emf induced when the switch is closed.
Find magnetic flux density at a point on the axis of a long solenoid having 5000 tums/m when it carrying a current of 2 A.
The magnetic flux linked with the coil (in Weber) is given by the equation- Փ = 5t2 + 3t + 16. The induced EMF in the coil at time, t = 4 will be ______.
The unit of magnetic flux in SI is ______
The dimensional formula of magnetic flux is ______.
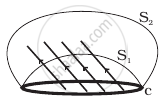
Consider a closed loop C in a magnetic field (Figure). The flux passing through the loop is defined by choosing a surface whose edge coincides with the loop and using the formula φ = B1.dA1 + B2.dA2 +... Now if we chose two different surfaces S1 and S2 having C as their edge, would we get the same answer for flux. Jusity your answer.