Advertisements
Advertisements
प्रश्न
Plot the points (x, y) given in the following table on the plane, choosing suitable units of distance on the axes.
| x | -2 | -1 | 0 | 1 | 3 |
| y | 8 | 7 | -1.25 | 3 | -1 |
उत्तर
The given points can be plotted on the Cartesian plane as follows.

APPEARS IN
संबंधित प्रश्न
In which quadrant or on which axis do each of the points (– 2, 4), (3, – 1), (– 1, 0), (1, 2) and (– 3, – 5) lie? Verify your answer by locating them on the Cartesian plane.
Plot the following point on the graph paper:
(7, −4)
Plot the following point on the graph paper:
(0, 7)
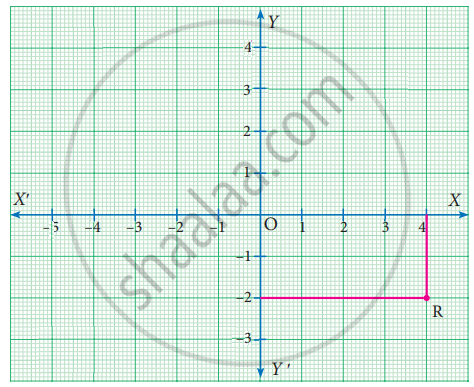
Write down the abscissa and ordinate of the following.
R
Plot the following points in the coordinate plane and join them. What is your conclusion about the resulting figure?
(−5, 3) (−1, 3) (0, 3) (5, 3)
Plot the following points in the coordinate plane. Join them in order. What type of geometrical shape is formed?
(−3, 3) (2, 3) (−6, −1) (5, −1)
Find the quadrants without plotting the point on a graph sheet.
(−9, 50)
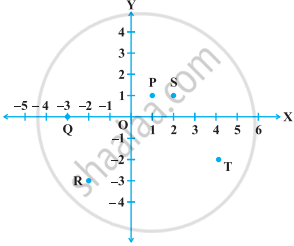
Write the coordinates of each of the points P, Q, R, S, T and O from the figure.

Plot the points (x, y) given by the following table. Use scale 1 cm = 0.25 units
| x | 1.25 | 0.25 | 1.5 | – 1.75 |
| y | – 0.5 | 1 | 1.5 | – 0.25 |
Taking 0.5 cm as 1 unit, plot the following points on the graph paper:
A(1, 3), B(– 3, – 1), C(1, – 4), D(– 2, 3), E(0, – 8), F(1, 0)
