Advertisements
Advertisements
प्रश्न
Prepare a bar graph of the data given in
| Surname | Number of people |
| Khan |  |
| Patel |  |
| Rao |  |
| Roy |  |
| Saikia |  |
| Singh |  |
उत्तर
Scale: 1 unit length = 50 people
APPEARS IN
संबंधित प्रश्न
Use the bar graph (see the given figure) to answer the following question.
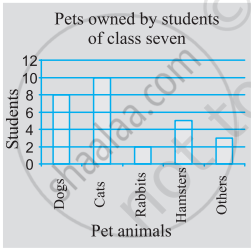
Which is the most popular pet?
Consider this data collected from a survey of a colony.
| Favourite sport | Cricket | Basket Ball | Swimming | Hockey | Athletics |
| Watching | 1240 | 470 | 510 | 430 | 250 |
| Participating | 620 | 320 | 320 | 250 | 105 |
- Draw a double bar graph choosing an appropriate scale. What do you infer from the bar graph?
- Which sport is most popular?
- Which is more preferred, watching or participating in sports?
The following table shows the number of Buses and Trucks in nearest lakh units. Draw percentage bar-diagram. (Approximate the percentages to the nearest integer)
| Year | No of trucks | No of buses |
| 2005-2006 2007-2008 2008-2009 2009-2010 |
47 56 60 63 |
9 13 16 18 |
Comparison of parts of a whole may be done by a ______.
The graph given below shows the marks obtained out of 10 by Sonia in two different tests. Study the graph and answer the questions that follow.
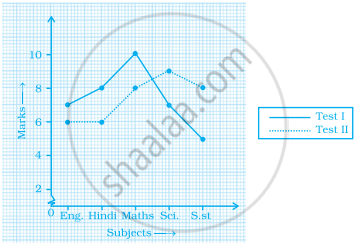
- What information is represented by the axes?
- In which subject did she score the highest in Test I?
- In which subject did she score the least in Test II?
- In which subject did she score the same marks in both the Tests?
- What are the marks scored by her in English in Test II?
- In which test was the performance better?
- In which subject and which test did she score full marks?
Study the bar graph given below and answer the questions that follow.

- What information does the above bar graph represent?
- In which year was production the least?
- After which year was the maximum rise in the production?
- Find the average production of rice during the 5 years.
- Find difference of rice production between years 2006 and 2008.
Study the double bar graphs given below and answer the following questions:

- Which sport is liked the most by Class VIII students?
- How many students of Class VII like Hockey and Tennis in all?
- How many students are there in Class VII?
- For which sport is the number of students of Class VII less than that of Class VIII?
- For how many sports students of Class VIII are less than Class VII?
- Find the ratio of students who like Badminton in Class VII to students who like Tennis in Class VIII.
In a public library, the following observations were recorded by the librarian in a particular week:
| Days | Mon | Tues | Wed | Thurs | Fri | Sat |
| Newspaper Readers |
400 | 600 | 350 | 550 | 500 | 350 |
| Magazines Readers |
150 | 100 | 200 | 300 | 250 | 200 |
- Draw a double bar graph choosing an appropriate scale.
- On which day, the number of readers in the library was maximum?
- What is the mean number of magazine readers?
Observe the following data:
| Government School, Chandpur | ||
| Daily Attendance | Date: 15.4.2009 | |
| Class | Total Students | Number of Students Present on that Day |
| VI | 90 | 81 |
| VII | 82 | 76 |
| VIII | 95 | 91 |
| IX | 70 | 65 |
| X | 63 | 62 |
- Draw a double bar graph choosing an appropriate scale. What do you infer from the bar graph?
- Which class has the maximum number of students?
- In which class, the difference of total students and number of students present is minimum?
- Find the ratio of number of students present to the total number of students of Class IX.
- What per cent of Class VI students were absent?
The marks out of 100 obtained by Kunal and Soni in the Half Yearly Examination are given below:
| Subjects | English | Hindi | Maths | Science | S. Science | Sanskirt |
| Kunal | 72 | 81 | 92 | 96 | 64 | 85 |
| Soni | 86 | 89 | 90 | 82 | 75 | 82 |
- Draw a double bar graph by choosing appropriate scale.
- Calculate the total percentage of marks obtained by Soni.
- Calculate the total percentage of marks obtained by Kunal.
- Compare the percentages of marks obtained by Kunal and Soni.
- In how many subjects did Soni get more marks than Kunal? Which are those subjects?
- Who got more marks in S. Science and what was the difference of marks?
- In which subject the difference of marks was maximum and by how much?
