Advertisements
Advertisements
प्रश्न
Scale: 1 unit length = 200 km
Prepare a pictograph of the data by taking a suitable symbol to represent 200 kilometers.
उत्तर
Let 200 km can be represented by NH and 100 km represented by N.
For NH 10, 500 km can be represented by 2 complete symbols and 1 incomplete symbol.
For NH 9, 900 km can be represented by 4 complete symbols and 1 incomplete symbol.
For NH 8, 1400 km can be represented by 7 complete symbols.
For NH 3, 1200 km can be represented by 6 complete symbols.
For NH 2, 1500 km can be represented by 7 complete symbols and 1 incomplete symbol.
Hence, the required pictograph of given data is shown below
Take ![]() = 200 km and
= 200 km and ![]() = 100 km
= 100 km
| National Highway | Length (in km) |
| NH 10 |  |
| NH 9 |  |
| NH 8 | |
| NH 3 |  |
| NH 3 |
APPEARS IN
संबंधित प्रश्न
Take the data giving the minimum and the maximum temperature of various cities given in the following table:
| Temperatures of the cities as on 20.6.2006 | ||
| City | Max. | Min. |
| Ahmedabad | 38ºC | 29ºC |
| Amritsar | 37ºC | 26ºC |
| Banglore | 28ºC | 21ºC |
| Chennai | 36ºC | 27ºC |
| Delhi | 38ºC | 28ºC |
| Jaipur | 39ºC | 29ºC |
| Jammu | 41ºC | 26ºC |
| Mumbai | 32ºC | 27ºC |
Plot a double bar graph using the data and answer the following:
- Which city has the largest difference in the minimum and maximum temperature on the given date?
- Which is the hottest city and which is the coldest city?
- Name two cities where maximum temperature of one was less than the minimum temperature of the other.
- Name the city which has the least difference between its minimum and the maximum temperature.
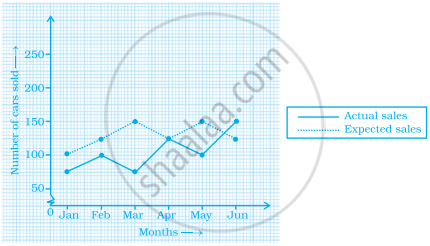
The graph given below gives the actual and expected sales of cars of a company for 6 months. Study the graph and answer the questions that follow.

- In which month was the actual sales same as the expected sales?
- For which month(s) was (were) the difference in actual and expected sales the maximum?
- For which month(s) was (were) the difference in actual and expected sales the least?
- What was the total sales of cars in the months–Jan, Feb. and March?
- What is the average sales of cars in the last three months?
- Find the ratio of sales in the first three months to the last three months
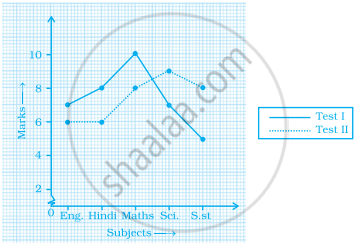
The graph given below shows the marks obtained out of 10 by Sonia in two different tests. Study the graph and answer the questions that follow.

- What information is represented by the axes?
- In which subject did she score the highest in Test I?
- In which subject did she score the least in Test II?
- In which subject did she score the same marks in both the Tests?
- What are the marks scored by her in English in Test II?
- In which test was the performance better?
- In which subject and which test did she score full marks?
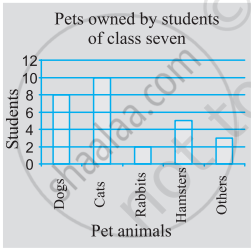
Use the bar graph (see the given figure) to answer the following question.

How many students have dog as a pet?
In a bar graph, the width of bars may be unequal.
The following graph gives the information about the number of railway tickets sold for different cities on a railway ticket counter between 6.00 am to 10.00 am. Read the bar graph and answer the following questions.
Scale: 1 unit length = 10 tickets
(a) How many tickets were sold in all?
(b) For which city were the maximum number of tickets sold?
(c) For which city were the minimum number of tickets sold?
(d) Name the cities for which the number of tickets sold is more than 20
(e) Fill in the blanks: Number of tickets sold for Delhi and Jaipur together exceeds the total number of tickets sold for Patna and Chennai by ______.
| Crop | Area of land (in million hectares) |
| Rice | 50 |
| Wheat | 30 |
| Pulses | 20 |
| Sugarcane | 25 |
| Cotton | 15 |
Prepare a bar graph of the data.
Study the double bar graphs given below and answer the following questions:

- Which sport is liked the most by Class VIII students?
- How many students of Class VII like Hockey and Tennis in all?
- How many students are there in Class VII?
- For which sport is the number of students of Class VII less than that of Class VIII?
- For how many sports students of Class VIII are less than Class VII?
- Find the ratio of students who like Badminton in Class VII to students who like Tennis in Class VIII.
The data given below shows the production of motorbikes in a factory for some months of two consecutive years.
| Months | Feb | May | August | October | December |
| 2008 | 2700 | 3200 | 6000 | 5000 | 4200 |
| 2007 | 2800 | 4500 | 4800 | 4800 | 5200 |
Study the table given above and answer the following questions:
- Draw a double bar graph using appropriate scale to depict the above information and compare them.
- In which year was the total output the maximum?
- Find the mean production for the year 2007.
- For which month was the difference between the production for the two years the maximum?
- In which month for the year 2008, the production was the maximum?
- In which month for the year 2007, the production was the least?
The table below gives the flavours of ice cream liked by children (boys and girls) of a society.
| Flavours | Vanilla | Chocolate | Strawberry | Mango | Butterscotch |
| Boys | 4 | 9 | 3 | 8 | 13 |
| Girls | 8 | 12 | 7 | 9 | 10 |
Study the table and answer the following questions:
- Draw a double bar graph using appropriate scale to represent the above information.
- Which flavour is liked the most by the boys?
- How many girls are there in all?
- How many children like chocolate flavour of ice cream?
- Find the ratio of children who like strawberry flavour to vanilla flavour of ice cream.
