Advertisements
Advertisements
प्रश्न
Shyam, Sita, Renu, Ahmed and John are five consumers of apples. Their demand for apples is given below. Derive the market demand schedule for apples.
| Price per Kg (in ₹) | Quantity Demanded (Apples) in Kg. | ||||
| Shyam | Sita | Renu | Ahmed | John | |
| 25.00 | 16 | 15 | 12 | 14 | 18 |
| 30.00 | 12 | 11 | 10 | 8 | 15 |
| 35.00 | 10 | 9 | 8 | 6 | 12 |
| 40.00 | 8 | 6 | 4 | 2 | 8 |
उत्तर
To derive the market demand schedule for apples, you sum the quantity demanded by all five consumers (Shyam, Sita, Renu, Ahmed, and John) at each price level. Here’s the step-by-step calculation based on the data provided:
- At ₹25 per Kg:
Total Market Demand = 16 + 15 + 12 + 14 + 18 = 75 Kg - At ₹30 per Kg:
Total Market Demand = 12 + 11 + 10 + 8 + 15 = 56 Kg - At ₹35 per Kg:
Total Market Demand = 10 + 9 + 8 + 6 + 12 = 45 Kg - At ₹40 per Kg:
Total Market Demand = 8 + 6 + 4 + 2 + 8 = 28 Kg
The market demand schedule, which you provided as a hint, matches the calculated totals:
- At ₹25 per Kg: 75 Kg
- At ₹30 per Kg: 56 Kg
- At ₹35 per Kg: 45 Kg
- At ₹40 per Kg: 28 Kg
APPEARS IN
संबंधित प्रश्न
With the help of suitable diagram explain the meaning of rightward shift in the demand curve. Explain briefly any two of its determinants.
The bus fare between two cities is reduced. How will this affect the demand curve for bus travel between the two cities?
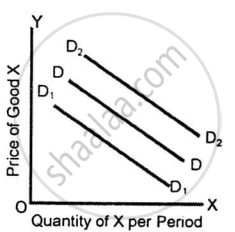
The diagram given below shows the original demand curve (DD) for good X, which is a complement of good Y:
If there is a rise in the price of good Y, which demand curve for good X is relevant?

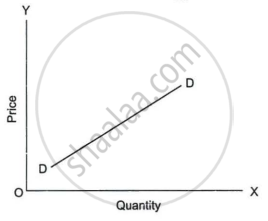
In the following diagram, the demand curve is upward sloping. Under what kind of goods is it possible?

Differentiate between individual demand schedule and market demand schedule.
Using hypothetical data show a market demand schedule.
State the impact of the following changes on the demand curve of a commodity:
increase in individual income
How is the market demand curve derived from the individual demand curves?
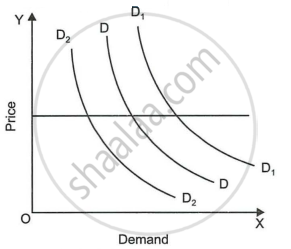
Explain the diagram given below.

What is a demand schedule?
