Advertisements
Advertisements
प्रश्न
State whether the following statement is True or False.
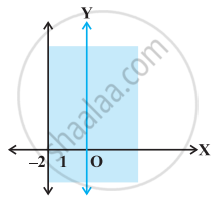
Graph of x > –2 is

विकल्प
True
False
उत्तर
This statement is False.
Explanation:
Because for x > –2, the line x = –2 has to be dotted i.e., the region does not include the points on the line x = –2.
APPEARS IN
संबंधित प्रश्न
Solve 24x < 100, when x is a natural number.
Solve –12x > 30, when x is a natural number.
Solve 5x – 3 < 7, when x is an integer.
Solve the given inequality for real x: 4x + 3 < 5x + 7.
Solve the given inequality for real x: 3(x – 1) ≤ 2 (x – 3)
Solve the given inequality for real x: `1/2 ((3x)/5 + 4) >= 1/3 (x -6)`
Solve the given inequality for real x: 37 – (3x + 5) ≥ 9x – 8(x – 3)
Solve the given inequality for real x: `x/4 < (5x - 2)/3 - (7x - 3)/5`
Solve the given inequality for real x: `((2x- 1))/3 >= ((3x - 2))/4 - ((2 - x))/5`
Solve the given inequality and show the graph of the solution on number line:
3x – 2 < 2x +1
Find all pairs of consecutive odd positive integers both of which are smaller than 10 such that their sum is more than 11.
Find all pairs of consecutive even positive integers, both of which are larger than 5 such that their sum is less than 23.
The longest side of a triangle is 3 times the shortest side and the third side is 2 cm shorter than the longest side. If the perimeter of the triangle is at least 61 cm, find the minimum length of the shortest side.
Solve the inequality.
`-3 <= 4 - (7x)/2 <= 18`
Solve the inequality.
`-15 < (3(x - 2))/5 <= 0`
Solve the inequality.
`-12 < 4 - (3x)/(-5) <= 2`
Solve the inequality.
`7 <= (3x + 11)/2 <= 11`
Represent to solution set of each of the following inequations graphically in two dimensional plane:
4. x − 2y < 0
Represent to solution set of each of the following inequations graphically in two dimensional plane:
5. −3x + 2y ≤ 6
Represent to solution set of each of the following inequations graphically in two dimensional plane:
0 ≤ 2x − 5y + 10
State whether the following statement is True or False.
If x > y and b < 0, then bx < by
State whether the following statement is True or False.
If xy > 0, then x > 0, and y < 0
State whether the following statement is True or False.
If xy < 0, then x > 0, and y > 0
State whether the following statement is True or False.
If |x| < 5, then x ∈ (–5, 5)
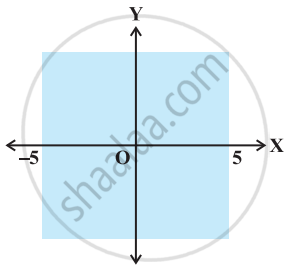
The inequality representing the following graph is ______.
