Advertisements
Advertisements
प्रश्न
The following distribution gives the daily income of 50 workers of a factory.
| Daily income (in ₹) | 200-220 | 220-240 | 240-260 | 260-280 | 280-300 |
| Number of workers | 12 | 14 | 8 | 6 | 10 |
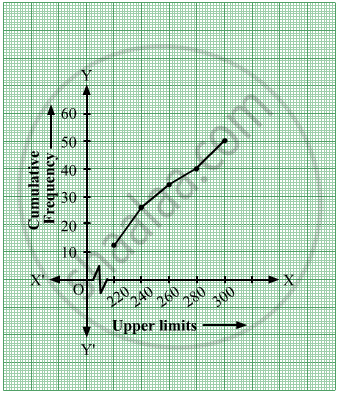
Convert the distribution above to a 'less than type' cumulative frequency distribution and draw its ogive.
उत्तर
The less than type cumulative frequency distribution table will be as follows:
| Daily income(in ₹) | Number of Workers | Daily Income Less than | Cumulative Frequency |
| 200 - 220 | 12 | 220 | 12 |
| 220 - 240 | 14 | 240 | 12 + 14 = 26 |
| 240 - 260 | 8 | 260 | 26 + 8 = 34 |
| 260 - 280 | 6 | 280 | 34 + 6 = 40 |
| 280 - 300 | 10 | 300 | 40 + 10 = 50 |
The ogive thus formed will be

APPEARS IN
संबंधित प्रश्न
The following table gives production yield in kg per hectare of wheat of 100 farms of a village :
| Production yield (kg/hectare) : |
40−45 | 45−50 | 50−55 | 55−60 | 60−65 | 65−70 |
| Number of farms | 4 | 6 | 16 | 20 | 30 | 24 |
Change the distribution to a 'more than type' distribution, and draw its ogive.
Draw the graph for the linear equation given below:
y = 3x
Draw the graph for the linear equation given below:
y = x
Draw the graph for the linear equation given below:
y = `(2x)/(3) - 1`
Draw the graph for the linear equation given below:
x + 5y + 2 = 0
Draw the graph for the equation given below:
`(2x - 1)/(3) - (y - 2)/(5) = 0`
On the same graph paper, plot the graph of y = x - 2, y = 2x + 1 and y = 4 from x= - 4 to 3.
Draw the graph of the equation 3x - 4y = 12.
Use the graph drawn to find:
(i) y1, the value of y, when x = 4.
(ii) y2, the value of y, when x = 0.
Draw the graph of the lines represented by the equations 3x - 2y = 4 and x + y = 3 on the same graph. Find the coordinates of the point where they intersect. State, whether the lines are perpendicular to each other.
Draw the graph of the lines represented by the equations 5y = 3x + 1 and y = 2x + 3 on the same graph. Find the coordinates of the point where they intersect.
