Advertisements
Advertisements
Question
The following distribution gives the daily income of 50 workers of a factory.
| Daily income (in ₹) | 200-220 | 220-240 | 240-260 | 260-280 | 280-300 |
| Number of workers | 12 | 14 | 8 | 6 | 10 |
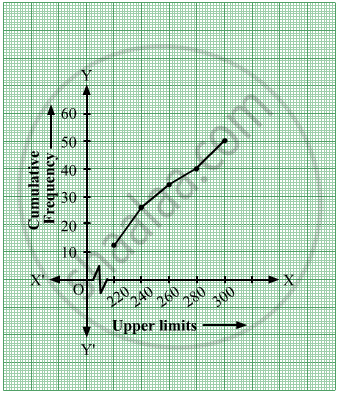
Convert the distribution above to a 'less than type' cumulative frequency distribution and draw its ogive.
Solution
The less than type cumulative frequency distribution table will be as follows:
| Daily income(in ₹) | Number of Workers | Daily Income Less than | Cumulative Frequency |
| 200 - 220 | 12 | 220 | 12 |
| 220 - 240 | 14 | 240 | 12 + 14 = 26 |
| 240 - 260 | 8 | 260 | 26 + 8 = 34 |
| 260 - 280 | 6 | 280 | 34 + 6 = 40 |
| 280 - 300 | 10 | 300 | 40 + 10 = 50 |
The ogive thus formed will be
APPEARS IN
RELATED QUESTIONS
Draw the graph of the equation given below.
x + y = 2
Draw the graph of the equation given below.
2x + y = 1
Draw the graph for the linear equation given below:
2x - 7 = 0
Draw the graph for the linear equation given below:
y = 4
Draw the graph for the linear equation given below:
y = - x
Draw the graph for the linear equation given below:
4x - y = 0
Draw the graph for the equation given below:
`(1)/(2) x + (2)/(3) y = 5`.
On the same graph paper, plot the graph of y = x - 2, y = 2x + 1 and y = 4 from x= - 4 to 3.
Use the graphical method to show that the straight lines given by the equations x + y = 2, x - 2y = 5 and `x/(3) + y = 0` pass through the same point.
Draw a graph of the equation 2x + 3y + 5 = 0, from the graph find the value of:
(i) x, when y = -3
(ii) y, when x = 8
