Advertisements
Advertisements
Question
Draw the graph of the equation given below.
x + y = 2
Solution
The equation of the given line is x + y = 2.
x + y = 2
⇒ y = 2 − x ...(1)
Putting x = 0 in (1), we get
y = 2 − 0
y = 2
Putting x = 2 in (1), we get
y = 2 − 2
y = 0
Putting x = −1 in (1), we get
y = 2 − (−1)
y = 2 + 1
y = 3
Putting x = 5 in (1), we get
y = 2 − 5
y = −3
These values can be represented in the table in the form of ordered pairs as follows:
| x | 0 | 2 | -1 | 5 |
| y | 2 | 0 | 3 | -3 |
| (x, y) | (0, 2) | (2, 0) | (-1, 3) | (5, -3) |
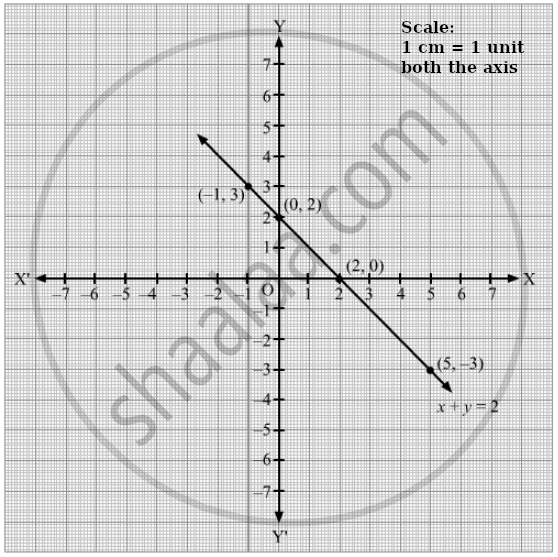
The line is the graph of the equation x + y = 2.
APPEARS IN
RELATED QUESTIONS
Draw the graph for the linear equation given below:
x + 3 = 0
Draw the graph for the linear equation given below:
y = 4
Draw the graph for the linear equation given below:
3y + 5 = 0
Draw the graph for the linear equation given below:
x = - 2y
Draw the graph for the linear equation given below:
y = 2x + 3
Draw the graph for the each linear equation given below:
y = `(3x)/(2) + (2)/(3)`
For the pair of linear equations given below, draw graphs and then state, whether the lines drawn are parallel or perpendicular to each other.
2x - 3y = 6
`x/(2) + y/(3) = 1`
On the same graph paper, plot the graph of y = x - 2, y = 2x + 1 and y = 4 from x= - 4 to 3.
The graph of 3x + 2y = 6 meets the x=axis at point P and the y-axis at point Q. Use the graphical method to find the co-ordinates of points P and Q.
Draw the graph of the lines represented by the equations 5y = 3x + 1 and y = 2x + 3 on the same graph. Find the coordinates of the point where they intersect.
