Advertisements
Advertisements
Question
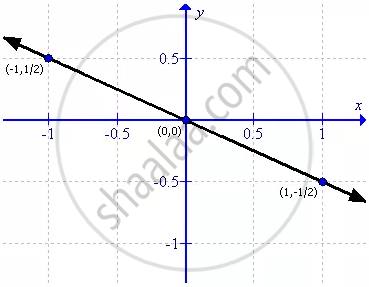
Draw the graph for the linear equation given below:
x = - 2y
Solution
First prepare a table as follows:
| x | -1 | 0 | 1 |
| y | `(1)/(2)` | 0 | -`(1)/(2)` |
Thus the graph can be drawn as follows:
APPEARS IN
RELATED QUESTIONS
Draw the graph of the equation given below.
2x + y = 1
Draw the graph for the linear equation given below:
x = 3
Draw the graph for the linear equation given below:
y = 0
Draw the graph for the linear equation given below:
4x - y = 0
For the linear equation, given above, draw the graph and then use the graph drawn (in the following case) to find the area of a triangle enclosed by the graph and the co-ordinates axes:
7 - 3 (1 - y) = -5 + 2x
The graph of 3x + 2y = 6 meets the x=axis at point P and the y-axis at point Q. Use the graphical method to find the co-ordinates of points P and Q.
Use the graphical method to show that the straight lines given by the equations x + y = 2, x - 2y = 5 and `x/(3) + y = 0` pass through the same point.
Draw the graph of the lines y = x + 2, y = 2x - 1 and y = 2 from x = -3 to 4, on the same graph paper. Check whether the lines drawn are parallel to each other.
Draw the graph of the lines represented by the equations x + y = 4 and 2x - y = 2 on the same graph. Find the coordinates of the point where they intersect
Draw the graph of the lines represented by the equations 3x - 2y = 4 and x + y = 3 on the same graph. Find the coordinates of the point where they intersect. State, whether the lines are perpendicular to each other.
