Advertisements
Advertisements
Question
Draw the graph of the lines y = x + 2, y = 2x - 1 and y = 2 from x = -3 to 4, on the same graph paper. Check whether the lines drawn are parallel to each other.
Solution
For,
y = x + 2
When x = 0, y = 0 + 2 = 2
When x = 5, y = 5 + 2 = 7
When x = -3, y = -3 + 2 = -1
| x | 0 | 5 | -3 |
| y | 2 | 7 | -1 |
For,
y = 2x - 1
When x = 0, y = 2(0) -1 = -1
When x = -2, y = 2(-2) -1 = -5
When x = 3, y = 2(3) -1 = 5
| x | 0 | -2 | 3 |
| y | -1 | -5 | 5 |
For,
y = 2
This line is parallel to the x-axis and passes through (0, 2)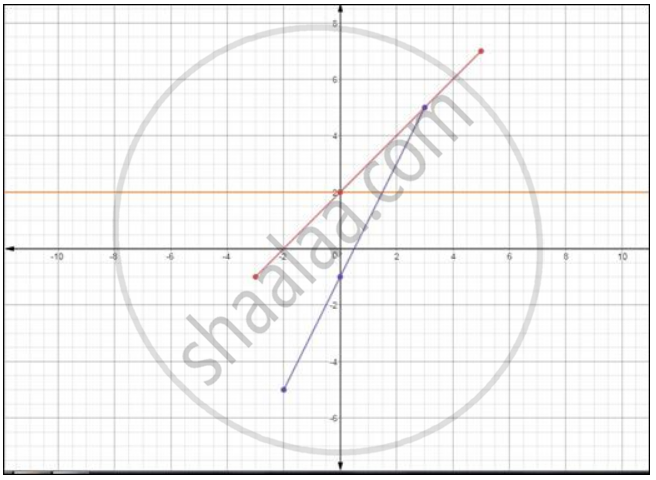
The lines are not parallel to each other.
APPEARS IN
RELATED QUESTIONS
Draw the graph for the linear equation given below:
y = 0
Draw the graph for the linear equation given below:
x = 0
Draw the graph for the linear equation given below:
y = - x
Draw the graph for the linear equation given below:
3x + 2y = 0
Draw the graph for the linear equation given below:
y = `(2x)/(3) - 1`
Draw the graph for the linear equation given below:
2x - 3y = 4
Draw a graph of each of the following equations: x + 6y = 15
Draw a graph of each of the following equations: 3y + 2x = 11
Draw a graph for each of the following equations and find the coordinates of the points where the line drawn meets the x-axis and y-axis: 2x + 3y = 12
Draw a graph of the equation 5x - 3y = 1. From the graph find the value of:
(i) x, when y = 8
(ii) y, when x = 2
