Advertisements
Advertisements
Question
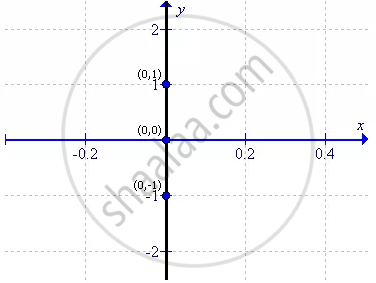
Draw the graph for the linear equation given below:
x = 0
Solution
First prepare a table as follows:
| x | 0 | 0 | 0 |
| y | -1 | 0 | 1 |
Thus the graph can be drawn as follows:
APPEARS IN
RELATED QUESTIONS
Draw the graph for the linear equation given below:
x + 3 = 0
Draw the graph for the linear equation given below:
y = 4
Draw the graph for the linear equation given below:
y = 3x
Draw the graph for the linear equation given below:
5x+ y = 0.
Draw the graph for the each linear equation given below:
y = `(3x)/(2) + (2)/(3)`
Draw the graph for the linear equation given below:
2x - 3y = 4
For the pair of linear equations given below, draw graphs and then state, whether the lines drawn are parallel or perpendicular to each other.
2x - 3y = 6
`x/(2) + y/(3) = 1`
Use the graphical method to show that the straight lines given by the equations x + y = 2, x - 2y = 5 and `x/(3) + y = 0` pass through the same point.
Find if the following points are collinear or not by using a graph:
(i) (-2, -1), (0, 3) and (1, 5)
(ii) (1, 3), (-2, -4) and (3, 5)
(iii) (2, -1), (2, 5) and (2, 7)
(iv) (4, -1), (-5, -1) and (3, -1)
Draw the graph of the lines represented by the equations 3x - 2y = 4 and x + y = 3 on the same graph. Find the coordinates of the point where they intersect. State, whether the lines are perpendicular to each other.
