Advertisements
Advertisements
Question
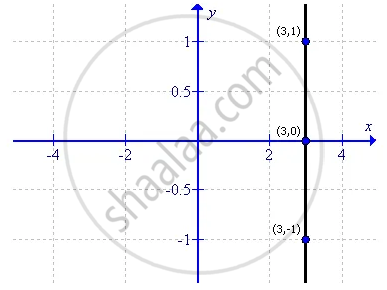
Draw the graph for the linear equation given below:
x = 3
Solution
Since x = 3, therefore the value of y can be taken as any real no.
First prepare a table as follows:
| x | 3 | 3 | 3 |
| y | -1 | 0 | 1 |
Thus the graph can be drawn as follows:
APPEARS IN
RELATED QUESTIONS
Draw the graph for the linear equation given below:
x + 3 = 0
Draw the graph for the linear equation given below:
y = - x
Draw the graph for the linear equation given below:
x + 5y + 2 = 0
For the pair of linear equations given below, draw graphs and then state, whether the lines drawn are parallel or perpendicular to each other.
y = 3x - 1
y = 3x + 2
Draw the graph of equation x + 2y - 3 = 0. From the graph, find:
(i) x1, the value of x, when y = 3
(ii) x2, the value of x, when y = - 2.
Draw a graph of each of the following equations: 3x - 2y = 6
Draw a graph of the equation 5x - 3y = 1. From the graph find the value of:
(i) x, when y = 8
(ii) y, when x = 2
Draw the graph of the lines represented by the equations x + y = 4 and 2x - y = 2 on the same graph. Find the coordinates of the point where they intersect
Draw the graph of the lines represented by the equations 2x - y = 8 and 4x + 3y = 6 on the same graph. Find the co-ordinates of the point where they intersect.
Draw the graph of the lines represented by the equations 5y = 3x + 1 and y = 2x + 3 on the same graph. Find the coordinates of the point where they intersect.
