Advertisements
Advertisements
प्रश्न
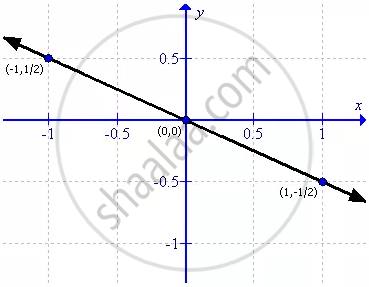
Draw the graph for the linear equation given below:
x = - 2y
उत्तर
First prepare a table as follows:
| x | -1 | 0 | 1 |
| y | `(1)/(2)` | 0 | -`(1)/(2)` |
Thus the graph can be drawn as follows:
APPEARS IN
संबंधित प्रश्न
Draw the graph of the equation given below.
3x - y = 0
Draw the graph for the linear equation given below:
y + 6 = 0
Draw the graph for the linear equation given below:
y - 2 = 0
Draw the graph for the linear equation given below:
x = 0
Draw the graph for the linear equation given below:
5x+ y = 0.
Draw the graph for the linear equation given below:
y = - x + 4
Draw the graph for the linear equation given below:
2x - 3y = 4
Draw the graph of equation `x/(4) + y/(5) = 1` Use the graph drawn to find:
(i) x1, the value of x, when y = 10
(ii) y1, the value of y, when x = 8.
Draw a graph of each of the following equations: y = `(3)/(5) x - 1`
Draw a graph for each of the following equations and find the coordinates of the points where the line drawn meets the x-axis and y-axis: `(2x)/(5) + y/(2)` = 1
