Advertisements
Advertisements
प्रश्न
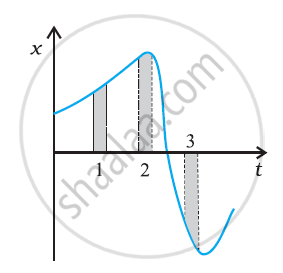
The following figure gives the x-t plot of a particle in one-dimensional motion. Three different equal intervals of time are shown. In which interval is the average speed greatest, and in which is it the least? Give the sign of average velocity for each interval.

उत्तर
The average speed of a particle depicted in the x-t graph is derived from the graph's slope during a specific time interval. The graph indicates that the slope is at its maximum and minimum in intervals 3 and 2, respectively. Hence, the particle's average speed is highest in interval 3 and lowest in interval 2. The average velocity's sign is positive in intervals 1 and 2, as the slope is positive within these intervals. However, it is negative in interval 3, as the slope is negative there.
APPEARS IN
संबंधित प्रश्न
A motor car is going due north at a speed of 50 km/h. It makes a 90° left turn without changing the speed. The change in the velocity of the car is about ______.
A person standing near the edge of the top of a building throws two balls A and B. the ball A is thrown vertically upward and B is thrown vertically downward with the same speed. The ball A hits the ground with a speed vA and the ball B this the ground with a speed vB. We have
The range of a projectile fired at an angle of 15° is 50 m. If it is fired with the same speed at an angle of 45°, its range will be
Consider the motion of the tip of the minute hand of a clock. In one hour
(a) the displacement is zero
(b) the distance covered is zero
(c) the average speed is zero
(d) the average velocity is zero
The velocity of a particle is zero at t = 0.
(a) The acceleration at t = 0 must be zero.
(b) The acceleration at t = 0 may be zero.
(c) If the acceleration is zero from t = 0 to t = 10 s, the speed is also zero in this interval.
(d) If the speed is zero from t = 0 to t = 10 s the acceleration is also zero in this interval.
Mark the correct statements:
An athlete takes 2.0 s to reach his maximum speed of 18.0 km/h. What is the magnitude of this average acceleration.
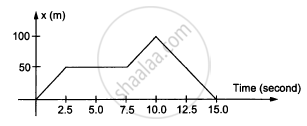
In the following figure shows the graph of the x-coordinate of a particle going along the X-axis as a function of time. Find the average velocity during 0 to 10 s,

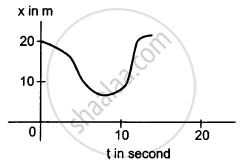
In the following figure shows x-t graph of a particle. Find the time t such that the average velocity of the particle during the period 0 to t is zero.

A vehicle travels half the distance L with speed V1 and the other half with speed V2, then its average speed is ______.
