Advertisements
Advertisements
प्रश्न
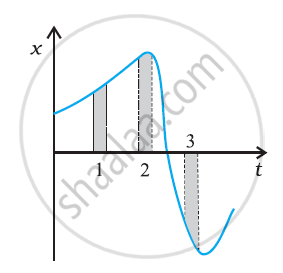
The following figure gives the x-t plot of a particle in one-dimensional motion. Three different equal intervals of time are shown. In which interval is the average speed greatest, and in which is it the least? Give the sign of average velocity for each interval.

उत्तर
The average speed of a particle depicted in the x-t graph is derived from the graph's slope during a specific time interval. The graph indicates that the slope is at its maximum and minimum in intervals 3 and 2, respectively. Hence, the particle's average speed is highest in interval 3 and lowest in interval 2. The average velocity's sign is positive in intervals 1 and 2, as the slope is positive within these intervals. However, it is negative in interval 3, as the slope is negative there.
APPEARS IN
संबंधित प्रश्न
A ball is thrown vertically upward with a speed of 20 m/s. Draw a graph showing the velocity of the ball as a function of time as it goes up and then comes back.
A person standing near the edge of the top of a building throws two balls A and B. the ball A is thrown vertically upward and B is thrown vertically downward with the same speed. The ball A hits the ground with a speed vA and the ball B this the ground with a speed vB. We have
Mark the correct statements:
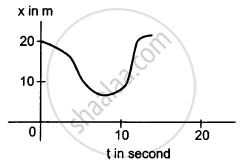
In figure shows the position of a particle moving on the X-axis as a function of time.

It is 260 km from Patna to Ranchi by air and 320 km by road. An aeroplane takes 30 minutes to go from Patna to Ranchi whereas a delux bus takes 8 hours. Find the average velocity of the plane.
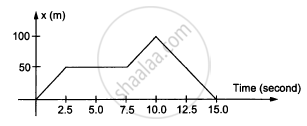
In the following figure shows the graph of the x-coordinate of a particle going along the X-axis as a function of time. Find the average velocity during 0 to 10 s,

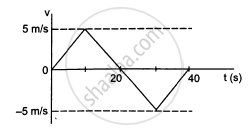
From the velocity-time plot shown in the following figure, find the distance travelled by the particle during the first 40 seconds. Also find the average velocity during this period.

In the following figure shows x-t graph of a particle. Find the time t such that the average velocity of the particle during the period 0 to t is zero.

Among the four graphs (Figure), there is only one graph for which average velocity over the time intervel (0, T ) can vanish for a suitably chosen T. Which one is it?
A vehicle travels half the distance L with speed V1 and the other half with speed V2, then its average speed is ______.
