Advertisements
Advertisements
प्रश्न
|
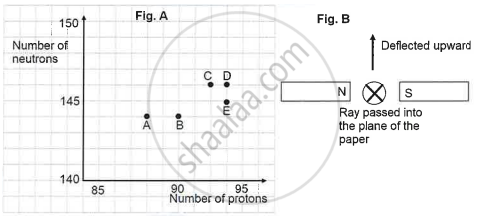
The graph (fig A) illustrates the correlation between the number of protons (x-axis) and the number of neutrons (y-axis) for elements A, B, C, D, and E in the periodic table. These elements are denoted by the letters rather than their conventional symbols. When the element C, depicted in the graph, undergoes radioactive decay, it releases radioactive rays. When these rays are directed into the plane of the paper in the presence of a magnetic field, as indicated in the fig B, they experience deflection, causing them to move upwards.
|
Name the law used to identify the radioactive radiation emitted by the element.
उत्तर
Flemings left hand rule
APPEARS IN
संबंधित प्रश्न
A positively-charged particle (alpha-particle) projected towards west is deflected towards north by a magnetic field. The direction of magnetic field is ______.
State whether the following statement is true or false
The field at the centre of a long circular coil carrying current will be parallel straight lines.
State the rule to determine the direction of a force experienced by a current-carrying straight conductor placed in a magnetic field which is perpendicular to it.
Observe the following figure:

If the current in the coil A is changed, will some current be induced in the coil B? Explain.
State the form of magnetic field lines around a straight current-carrying conductor.
What is the shape of a current-carrying conductor whose magnetic field pattern resembles that of a bar magnet?
Which way does the wire in the diagram below tend to move?

What do you know about Michael Faraday?
Observe the given figure of Fleming's Left Hand Rule and write the labels of 'A' and 'B':

If the strength of the current flowing through a wire is increased, the strength of the magnetic field produced by it ______.

