Advertisements
Advertisements
प्रश्न
The pie diagram in figure shows the proportions of different workers in a town. Answer the following question with its help.
If the total workers is 10,000; how many of them are in the field of construction ?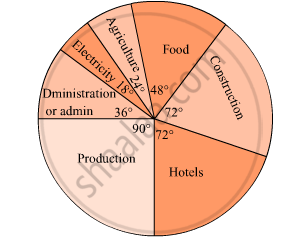
उत्तर
Number of workers working in the field of construction
= 2000
संबंधित प्रश्न
The sales of salesmen in a week are given in the pie diagram. Study the diagram and answer the following questions. If the total sale due to salesmen A is Rs. 18,000, then
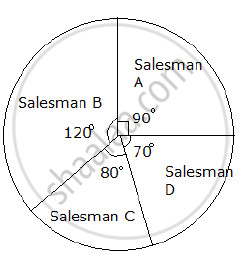
a) Find the total sale.
b) Find the sale of each salesman.
c) Find the salesman with the highest sale.
d) Find the difference between the highest sale and the lowest sale.
The marks obtained by a student in an examination out of 100 are given below. The total marks obtained in various subjects are as follows:
| Subject | Marks |
| Marathi | 85 |
| English | 85 |
| Science | 90 |
| Mathematics | 100 |
| Total | 360 |
Represent the above data using pie diagram
The following data gives the amount spent on the construction of a house. Draw a pie diagram.
| Items | Cement | Timber | Bricks | Labour | Steel | Miscellaneous |
| Expenditure (in thousand Rs) |
60 | 30 | 45 | 75 | 45 | 45 |
Represent the following data by a pie-diagram:
| Items of expenditure | Expenditure | |
| Family A | Family B | |
| Food | 4000 | 6400 |
| Clothing | 2500 | 480 |
| Rent | 1500 | 3200 |
| Education | 400 | 1000 |
| Miscellaneous | 1600 | 600 |
| Total | 10000 | 16000 |
Following data gives the break up of the cost of production of a book:
| Printing | Paper | Binding charges | Advertisement | Royalty | Miscellaneous |
| 30% | 15% | 15% | 20% | 10% | 15% |
Draw a pie- diagram depicting the above information.
Draw a pie-diagram representing the relative frequencies (expressed as percentage) of the eight classes as given below:
12.6, 18.2, 17.5, 20.3, 2.8, 4.2, 9.8, 14.7
A survey of students was made to know which game they like. The data obtained in the survey is presented in the adjacent pie diagram. If the total number of students are 1000,
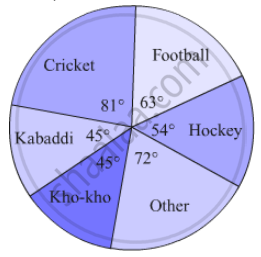
(1) How many students like cricket ?
(2) How many students like football ?
(3) How many students prefer other games ?
On an environment day, students in a school planted 120 trees under plantation project. The information regarding the project is shown in the following table. Show it by a pie diagram.
|
Tree name
|
Karanj | Behada | Arjun | Bakul | Kadunimb |
| No. of trees | 20 | 28 | 24 | 22 | 26 |
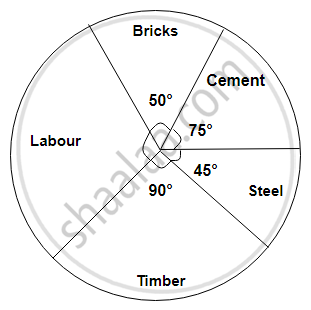
The following diagram represents expenditure on different items in constructing a building.
If the total construction cost of a building is Rs.540000, answer the following questions :
Find the central angle for labour expenditure.
Subjective marks obtained by a student in an examination are given below:
| Subject | Marks |
| Marathi | 85 |
| English | 90 |
| Science | 85 |
| Mathematics | 100 |
| Total | 360 |
Draw a pie diagram to represent the above data.
Write down the percentage of content in human body from the given pie-chart.
Draw a pie-chart for the favourite sweets of your family members
Collect information about the favorite pets of your classmates. Draw bar-graph and pie-chart for the same data
Students of a class voted for their favourite colour and a pie chart was prepared based on the data collected.
Observe the pie chart given below and answer questions based on it.
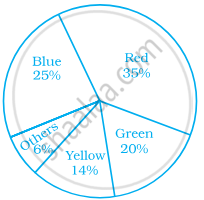
Which of the following is a reasonable conclusion for the given data?
The following pie chart represents the distribution of proteins in parts of a human body. What is the ratio of distribution of proteins in the muscles to that of proteins in the bones?

Data represented using circles is known as ______.
The central angle of a sector in a pie chart cannot be more than 180°.
The following pie chart depicts the expenditure of a state government under different heads.
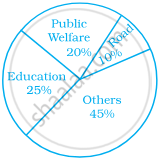
- If the total spending is 10 crores, how much money was spent on roads?
- How many times is the amount of money spent on education compared to the amount spent on roads?
- What fraction of the total expenditure is spent on both roads and public welfare together?
