Advertisements
Advertisements
प्रश्न
The table below gives the number of children who took part in the various items of the talent show as part of the annual school gathering. Make a bar graph to show this data.
(Scale: on Y-axis, 1cm = 4 children)
| Programme | Theatre | Dance | Vocal music | Instrumental music | One-act plays |
| No. of students | 24 | 40 | 16 | 8 | 4 |
उत्तर
Steps to draw the bar graph:
- In the centre of the graph paper, write the title "Programmes and number of children".
- Draw the X-axis and Y-axis, and mark O, their point of intersection.
- Write the name of the programmes on the X-axis at equal distances.
- The number of children taking part in the various items of the talent show is taken on the Y-axis.
- Write the scale in the top right-hand corner i.e. 1 cm = 4 children on the Y-axis.
- Draw a bar of the appropriate height above the name of each programme on the X-axis.

संबंधित प्रश्न
The names of the heads of some families in a village and the quantity of drinking water their family consumes in one day are given below. Draw a bar graph for this data.
(Scale: On Y-axis, 1cm = 10 litres of water)
| Name | Ramesh | Shobha | Ayub | Julie | Rahul |
| Litres of water used | 30 litres | 60 litres | 40 litres | 50 litres | 55 litres |
The names and numbers of animals in a certain zoo are given below. Use the data to make a bar graph. (Scale : on Y - axis, 1cm = 4 animals)
| Animals | Deer | Tiger | Monkey | Rabbit | Peacock |
| Number | 20 | 4 | 12 | 16 | 8 |
Students planted trees in 5 villages of Sangli district. Make a bar graph of this data. (Scale: on Y-axis, 1cm = 100 trees)
| Name of place | Dudhgaon | Bagni | Samdoli | Ashta | Kavathepiran |
| No. of trees planted | 500 | 350 | 600 | 420 | 540 |
Write the names of four of your classmates. Beside each name, write his/her weight in kilograms. Enter this data in a table like the above and make a bar graph.
Chitra has to buy Laddus in order to distribute to her friends as follow: Draw a Bar Graph for this data
| Classes | VI | VII | VIII | IX | X |
| Number of Laddus | 70 | 60 | 45 | 80 | 55 |
The pictograph below gives the number of absentees on different days of the week in class six. Draw the Bar graph for the same.
| Day | Monday | Tuesday | Wednesday | Thursday | Friday | Saturday |
| Number of Absentees |  |
 |
 |
 |
-- |  |
represents 4 students represents 2 students
The bar graph illustrates the results of a survey conducted on vehicles crossing over a Toll Plaza in one hour.
Observe the bar graph carefully and fill up the following table.
| Vehicles | Buses | _____ | Cars | Vans | _____ | Others | Total vehicles |
| Number of Vehicles |
_____ | 45 | _____ | _____ | 30 | ______ | ______ |
The bar chart represents the number of students using different modes of transport. Observe and answer the following questions.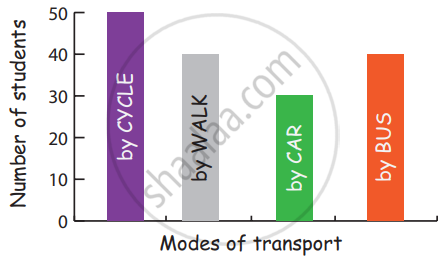
Questions
a. Which mode of transport is mostly used by the students? _____________
b. How many students come to school by walk? ____________
c. Which mode of transport is used the least? ____________
d. How many students come to school by bus? ____________
Data was collected on a student’s typing rate and graph was drawn as shown below. Approximately how many words had this student typed in 30 seconds?

The number of ATMs of different banks in a city is shown below:
| Bank | Number of ATMs |
| Syndicate Bank | 5 |
| Dena Bank | 15 |
| Indian Bank | 20 |
| State Bank of India | 25 |
| Vijaya Bank | 10 |
Draw a bar graph to represent the above information by choosing the scale of your choice.
