Advertisements
Advertisements
प्रश्न
The table below gives the number of children who took part in the various items of the talent show as part of the annual school gathering. Make a bar graph to show this data.
(Scale: on Y-axis, 1cm = 4 children)
| Programme | Theatre | Dance | Vocal music | Instrumental music | One-act plays |
| No. of students | 24 | 40 | 16 | 8 | 4 |
उत्तर
Steps to draw the bar graph:
- In the centre of the graph paper, write the title "Programmes and number of children".
- Draw the X-axis and Y-axis, and mark O, their point of intersection.
- Write the name of the programmes on the X-axis at equal distances.
- The number of children taking part in the various items of the talent show is taken on the Y-axis.
- Write the scale in the top right-hand corner i.e. 1 cm = 4 children on the Y-axis.
- Draw a bar of the appropriate height above the name of each programme on the X-axis.

संबंधित प्रश्न
The names of the heads of some families in a village and the quantity of drinking water their family consumes in one day are given below. Draw a bar graph for this data.
(Scale: On Y-axis, 1cm = 10 litres of water)
| Name | Ramesh | Shobha | Ayub | Julie | Rahul |
| Litres of water used | 30 litres | 60 litres | 40 litres | 50 litres | 55 litres |
The number of customers who came to a juice centre for one week is given in the table below. Make two different bar graphs to show this data. (Scale: on Y-axis, 1cm = 10 customers, on Y - axis, 1cm = 5 customers)
| Type of juice | Orange | Pineapple | Apple | Mango | Pomegranate |
| No. of Customers | 50 | 30 | 25 | 65 | 10 |
Yashwant gives different amounts of time as shown below, to different exercises he does during the week. Draw a bar graph to show the details of his schedule using an appropriate scale.
| Type of exercise | Running | Yogasanas | Cycling | Mountaineering | Badminton |
| Time | 35 Minutes | 50 minutes | 1 hr 10 min | `1 1/2` hours | 45 minutes |
The fruits liked by the students of a class are as follow: Draw a Bar Graph for this data.
| Fruits | Bananas | Grapes | Apples | Mangoes | Guavas | Papayas | Other fruits |
| Number of students |
8 | 10 | 8 | 7 | 12 | 3 | 2 |
The table shows the number of moons that orbit each of the planets in our solar system.
| Planet | Mercury | Venus | Earth | Mars | Jupiter | Saturn | Uranus | Neptune |
| Number of Moons |
0 | 0 | 1 | 2 | 28 | 30 | 21 | 8 |
Make a Bar graph for the above data
The bar chart represents the number of students using different modes of transport. Observe and answer the following questions.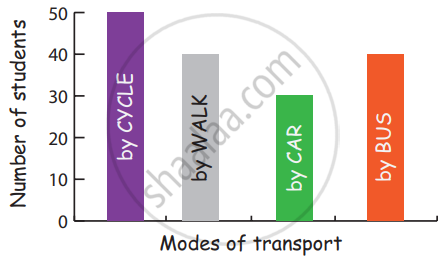
Questions
a. Which mode of transport is mostly used by the students? _____________
b. How many students come to school by walk? ____________
c. Which mode of transport is used the least? ____________
d. How many students come to school by bus? ____________
Data was collected on a student’s typing rate and graph was drawn as shown below. Approximately how many words had this student typed in 30 seconds?

Draw a graph for the radius and circumference of circle using a suitable scale.
(Hint: Take radius = 7, 14, 21 units and so on)
From the graph,
- Find the circumference of the circle when radius is 42 units.
- At what radius will the circumference of the circle be 220 units?
Home appliances sold by a shop in one month are given as below:
| Home appliance | Number of home appliances |
| Refrigerator | 75 |
| Television | 45 |
| Washing Machine | 30 |
| Cooler | 60 |
| DVD Player | 30 |
Draw a bar graph to represent the above information.
A survey of 120 school students was done to find which activity they prefer to do in their free time.
| Preferred activity | Number of students |
| Playing | 45 |
| Reading story books | 30 |
| Watching TV | 20 |
| Listening to music | 10 |
| Painting | 15 |
Draw a bar graph to illustrate the above data taking a scale of 1 unit length = 5 students.
Which activity is preferred by most of the students other than playing?
