Advertisements
Advertisements
प्रश्न
Why do some states of India have higher rates of work participation than others?
उत्तर
The work participation rate is the number of people engaged in economic activities. Some states of India like Himachal Pradesh, Sikkim, Chhattisgarh, Andhra Pradesh, etc. tend to have higher work participation rates. The work participation rate tends to be higher in the areas of lower levels of economic development since the number of manual workers is needed to perform the subsistence or near subsistence economic activities in the absence of other opportunities.
APPEARS IN
संबंधित प्रश्न
Give a geographical reason:
Demographic dividend increases when the proportion of the working population increases.
Complete the chain
| Sr. No. | A | B | C |
| 1. | Expansive age pyramid | Low birth-death rate | High medical expenses |
| 2. | Constrictive age pyramid | Human capital | Unwillingness |
| 3. | Stationery age pyramid | Low number of old people | Demographic dividend |
| 4. | High working population | Problem of subsistence | Developed country |
| 5. | Migration due to drought | High number of old people | Economically backward |
Give geographical reason
Less population is engaged in agriculture in developed countries
Identify the incorrect factor
Factors having direct relation with literacy:
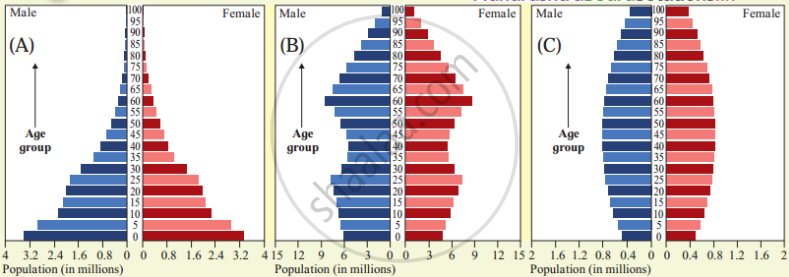
Observe the following graph and answer the question given below:

Questions:
- Which pyramid(s) represent(s) a country with high medical expenditure?
- Which pyramid(s) represent(s) a country with a large manpower?
- In which pyramid(s) the number of old people will be the least?
- What is the reason of the broad shape of A pyramid?
- Why C pyramid looks vertical in shape?
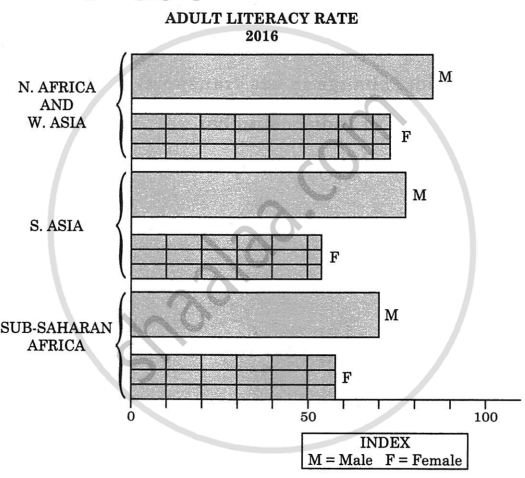
Observe the following graph and answer the question given below

Question:
- Which region has the highest literacy rate?
- Which region has the lowest literacy rate?
- In which region does women fare better than men in literacy rate?
- Write a concluding paragraph about the graph.
- Which is the type of graph?
Write short note
Population pyramid and sex ratio
Which one of the following states has the highest proportion of the urban population in India according to the 2001 Census?
‘The agricultural sector has the largest share of Indian workers.’ – Explain.
Which one of the following has caused the sex ratio of the United Arab Emirates to be low?
What do you understand by population composition?
Divide population based on the place of residence.
What does the literacy rate denote for India?
What does the literacy rate of a country indicate?
Which country has the lowest sex ratio in the world?
How is sex ratio calculated in different countries of the world?
Why is the age structure considered an important indicator of population composition? Give one reason.
“In some countries of the world, the sex ratio is unfavourable to women.” Give one reason.
What is the meaning of the Age Structure of population? Describe in brief four main characteristics of the age structure of the world population.
Which of these language families is predominant in India?
Where does India rank in the world as regards area?
Which state has the highest sex ratio?
Which of the following is the largest religious minority in India?
A worker is known as main worker, who works atleast ____________.
Which one of the following country has highest sex ratio in the world?
The lowest sex ratio is found in ______.
In how many countries, unfavourable sex ratio is found?
In European countries, a deficit of males is due to ______.
In which continent, low sex ratio is found?
Which one of the following countries has the highest sex ratio in the world?
Which diagram shows age-sex structure?
The largest country in Asia Continent in terms of area ______
Which of the following options, represent the correct order of states according to the population?
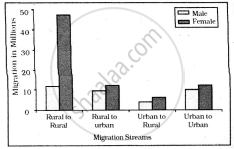
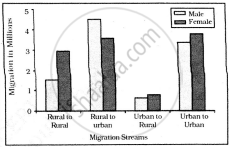
Study the given graph carefully and answer the following question:

Intra-state Migration by place of Last Residence Indicating Migration Streams India, 2011

Inter-state Migration by Place of Last Residence Indicating Migration Streams India, 2011
Which stream of migration shows the lowest trend in intra-state migration?
Table: India-Class-wise number of towns and cities and their population, 2011
| Class | Population Size | Number of Cities | Total Urban Population (in thousands) | % of Total Urban Population |
| I | 1,00,000 & more | 568 | 2,27,899 | 60-45 |
| II | 50,000-99,999 | 474 | 41,328 | 10-96 |
| III | 20,000-49,999 | 1,373 | 58,174 | 15-43 |
| IV | 10,000-19,999 | 1,683 | 31,866 | 8-45 |
| V | 5,000-9,999 | 1,749 | 15,883 | 4-21 |
| VI | less than 5,000 | 424 | 1,956 | 0-52 |
Source: Census of India-2011 and India 2017, Ministry of Information and Broadcasting, Government of India.
Which class town has the minimum urban population?
The highest sex ratio is found in:
Which of the following is true about natural advantage and social disadvantage?
The developed countries having low birth and death rates come under which category?
Match the following and choose the correct option.
| Population | Pyramid shape |
| A. Constant population | 1. Perfect triangle shape |
| B. Declining population | 2. Bell shape |
| C. Expanding population | 3. Narrow Base & Tapered Top Shape |
Mining is a ______.
Which type of population pyramid usually characterises developed countries where population growth is zero?
A country having pyramid of population that has a wide base and sharply tapered top is characterised by which of the following?
"India is a land of linguistic diversity." Support the statement.
Write a short note on:
Demographic dividend.
Which one of the following is the largest linguistic group of India?
Which one of the following is the largest linguistic group of India?
Read the following graph and answer the questions given below:

Questions:
- Which region has a very less adult female literacy rate?
- Why the percentage of adult male literacy rate is more in the given regions?
- Why the percentage of female-male literacy rate in 2016 is less in sub-Saharan Africa?
- Write your own opinion about the adult female literacy rate with reference to the graph.
- With reference to graph which country would be advanced in social factors?
Which one of the following is the largest linguistic group of India?
Which one of the following is the largest linguistic group of India?
Which one of the following is the largest linguistic group of India?
