Advertisements
Advertisements
प्रश्न
"India is a land of linguistic diversity." Support the statement.
उत्तर
- India is a land of linguistic diversity. According to Grierson (Linguistic Survey of India, 1903 – 1928), there were 179 languages and as many as 544 dialects in the country.
- In the context of modern India, there are about 22 scheduled languages and a number of non-scheduled languages.
- Among the scheduled languages, the speakers of Hindi have the highest percentage. The smallest language groups are Sanskrit, Bodo and Manipuri speakers (2011).
APPEARS IN
संबंधित प्रश्न
Write a short note on literacy rate.
Give a geographical reason:
Demographic dividend increases when the proportion of the working population increases.
Answer in detail:
Explain the rural and urban population structure.
Broad base with narrowing apex shows that more people die at each higher band. It shows ______.
Complete the chain
| Sr. No. | A | B | C |
| 1. | Expansive age pyramid | Low birth-death rate | High medical expenses |
| 2. | Constrictive age pyramid | Human capital | Unwillingness |
| 3. | Stationery age pyramid | Low number of old people | Demographic dividend |
| 4. | High working population | Problem of subsistence | Developed country |
| 5. | Migration due to drought | High number of old people | Economically backward |
Give geographical reason
Demographic dividend increases when proportion of working population increases.
Identify the incorrect factor
Regions having sex ratio more than one thousand:
Identify the incorrect factor
Difference in population according to rural-urban structure:
Observe the following graph and answer the question given below

Question:
- Which region has the highest literacy rate?
- Which region has the lowest literacy rate?
- In which region does women fare better than men in literacy rate?
- Write a concluding paragraph about the graph.
- Which is the type of graph?
Observe the following graph and answer the question given below:

Question:
- Which type of the graph shown above?
- In which age group male percentage is highest?
- In which age group female percentage is lowest?
- Whose percentage is highest in 30-39 age group?
- In which age group female percentage is higher than male percentage?
Write short note.
Literacy and education
Which one of the following is the largest linguistic group of India?
Why do some states of India have higher rates of work participation than others?
Give an account of the occupational structure of India’s population.
Which one of the following figures represents the working age group of the population?
Which one of the following countries has the highest sex ratio in the world?
What do you understand by population composition?
What is the significance of age-structure?
Which country has the highest sex ratio in the world?
Name the country with the lowest sex ratio in the world.
What does the literacy rate denote for India?
What was the percentage of urban population in the world in 2011?
“In some countries of the world, the sex ratio is unfavourable to women.” Give one reason.
What is the meaning of the Age Structure of population? Describe in brief four main characteristics of the age structure of the world population.
Describe the main characteristics of each of the major groups of human occupations in the world.
Which state has the highest sex ratio?
How many Million Plus towns are there in India (in 2001)?
What is life expectancy in India?
The literacy rate in India is ______.
Which one of the following country lowest sex ratio in the world?
Which one of the following reflected by Age-Sex pyramid?
In how many countries, unfavourable sex ratio is found?
In European countries, a deficit of males is due to ______.
According to the UNO, how many countries have sex ratio favourable for females?
Which diagram shows age-sex structure?
Which of the following programs sponsored by the central government aims at enabling the rural population to conserve water for drinking, irrigation, fisheries and afforestation?
Which of the following pairs is not matched correctly?
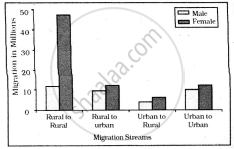
Study the given graph carefully and answer the following question:

Intra-state Migration by place of Last Residence Indicating Migration Streams India, 2011

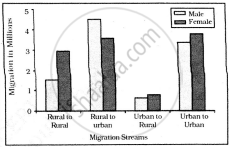
Inter-state Migration by Place of Last Residence Indicating Migration Streams India, 2011
Which stream of migration shows the lowest trend in interstate migration?
Study the given graph carefully and answer the following question:

Intra-state Migration by place of Last Residence Indicating Migration Streams India, 2011

Inter-state Migration by Place of Last Residence Indicating Migration Streams India, 2011
Which stream of migration shows the lowest trend in intra-state migration?
Sex ratio in the world is calculated as?
Which of the following is true about natural advantage and social disadvantage?
Population composition means
Which of the following is not a reason of unfavourable sex ratio against women?
Identify the country with the highest sex-ratio in the world.
Which of the following is true about age sex pyramid?
- It depicts number of males and females in different age groups.
- It is of various shapes, depending upon the population of a country.
- Age-sex pyramid of Bangladesh and Mexico are similar.
Match the following and choose the correct option.
| Population | Pyramid shape |
| A. Constant population | 1. Perfect triangle shape |
| B. Declining population | 2. Bell shape |
| C. Expanding population | 3. Narrow Base & Tapered Top Shape |
Which group is also known as post-reproductive group?
Arrange according to increase in age :
- Adults
- Children
- Old people
- Young people
Assertion: India is agrarian country.
Reason: Population engaged in agriculture is high in India.
Observe the following graph and answer the question given below.

- Which region has the highest literacy rate?
- Which region has the lowest literacy rate?
- In which region does women fare better than men in literacy rate?
- Write a concluding paragraph about the graph.
- What does this graph tells us?
Which one of the following is the largest linguistic group of India?
Which one of the following is the largest linguistic group of India?
Which one of the following is the largest linguistic group of India?
Which one of the following is the largest linguistic group of India?
Which one of the following is the largest linguistic group of India?
Which one of the following is the largest linguistic group of India?
