Advertisements
Advertisements
प्रश्न
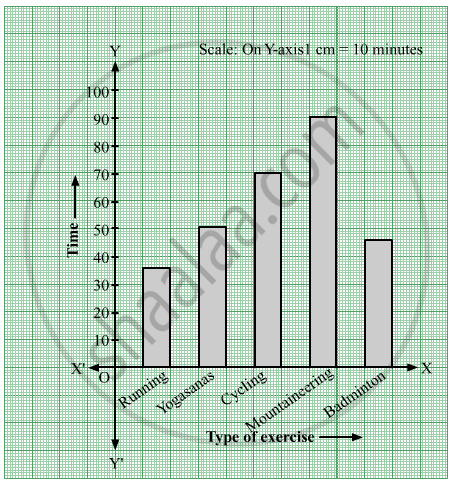
Yashwant gives different amounts of time as shown below, to different exercises he does during the week. Draw a bar graph to show the details of his schedule using an appropriate scale.
| Type of exercise | Running | Yogasanas | Cycling | Mountaineering | Badminton |
| Time | 35 Minutes | 50 minutes | 1 hr 10 min | `1 1/2` hours | 45 minutes |
उत्तर
Steps to draw the bar graph:
- In the centre of the graph paper, write the title "Exercises and time".
- Draw the X-axis and Y-axis, and mark O, their point of intersection.
- Write the type of exercise on the X-axis at equal distances.
- The time is taken on the Y-axis.
- Write the scale in the top right-hand corner i.e. 1 cm = 10 minutes on the Y-axis.
Here, `1 1/2` hours = 1 hour 30 minutes = 90 minutes, 1 hr 10 min = 70 minutes (1 hour = 60 minutes) - Draw a bar of the appropriate height above the type of each exercise on the X-axis.
संबंधित प्रश्न
This bar graph shows the maximum temperatures in degrees Celsius in different cities on a certain day in February. Observe the graph and answer the questions.

- What data is shown on the vertical and the horizontal lines?
- Which city had the highest temperature?
- Which cities had equal maximum temperatures?
- Which cities had a maximum temperature of 30° C?
- What is the difference between the maximum temperatures of Panchgani and Chandrapur?
Write the names of four of your classmates. Beside each name, write his/her weight in kilograms. Enter this data in a table like the above and make a bar graph.
Read the given Bar Graph which shows the percentage of marks obtained by Brinda in different subjects in an assessment test.
Observe the Bar Graph and answer the following questions.
(i) 1 Unit = __________% of marks on vertical line.
(ii) Brinda has scored maximum marks in __________ subject.
(iii) Brinda has scored minimum marks in __________ subject.
(iv) The percentage of marks scored by Brinda in Science is __________.
(v) Brinda scored 60% marks in the subject __________.
(vi) Brinda scored 20% more in __________ subject than __________ subject.
The table shows the number of moons that orbit each of the planets in our solar system.
| Planet | Mercury | Venus | Earth | Mars | Jupiter | Saturn | Uranus | Neptune |
| Number of Moons |
0 | 0 | 1 | 2 | 28 | 30 | 21 | 8 |
Make a Bar graph for the above data
The bar graph illustrates the results of a survey conducted on vehicles crossing over a Toll Plaza in one hour.
Observe the bar graph carefully and fill up the following table.
| Vehicles | Buses | _____ | Cars | Vans | _____ | Others | Total vehicles |
| Number of Vehicles |
_____ | 45 | _____ | _____ | 30 | ______ | ______ |
The lengths (in the nearest centimetre) of 30 drumsticks are given as follows.
| Lengths | Number of drumsticks |
| 24 | |||| |
| 25 | -- |
| 26 | -- |
| 27 | |||| | |
| 28 | -- |
| 29 | |||| ||| |
| 30 | |||| | |
| 31 | |||| |
Draw the bar graph showing the same information.
Data was collected on a student’s typing rate and graph was drawn as shown below. Approximately how many words had this student typed in 30 seconds?

The horizontal and vertical line in a line graph are usually called ______ and ______.
Complete the given table and draw a graph.
| x | 0 | 1 | 2 | 3 |
| y = 3x + 1 | 1 | 4 | - | - |
The following table shows the number of bicycles manufactured in a factory from the years 1998 to 2002. Illustrate this data using a bar graph. Choose a scale of your choice.
| Years | Number of bicycles manufactured |
| 1998 | 800 |
| 1999 | 600 |
| 2000 | 900 |
| 2001 | 1100 |
| 2002 | 1200 |
- In which year was the maximum number of bicycles manufactured?
- In which year was the minimum number of bicycles manufactured?
