Advertisements
Advertisements
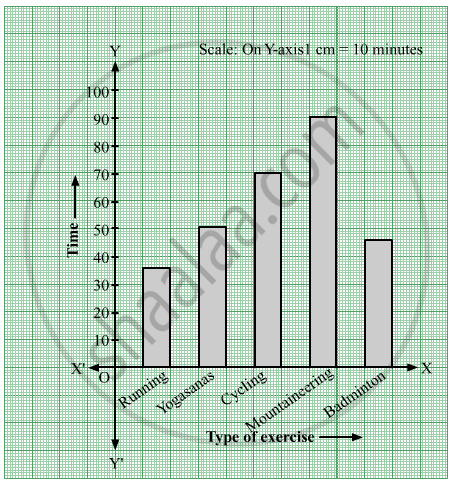
Question
Yashwant gives different amounts of time as shown below, to different exercises he does during the week. Draw a bar graph to show the details of his schedule using an appropriate scale.
| Type of exercise | Running | Yogasanas | Cycling | Mountaineering | Badminton |
| Time | 35 Minutes | 50 minutes | 1 hr 10 min | `1 1/2` hours | 45 minutes |
Solution
Steps to draw the bar graph:
- In the centre of the graph paper, write the title "Exercises and time".
- Draw the X-axis and Y-axis, and mark O, their point of intersection.
- Write the type of exercise on the X-axis at equal distances.
- The time is taken on the Y-axis.
- Write the scale in the top right-hand corner i.e. 1 cm = 10 minutes on the Y-axis.
Here, `1 1/2` hours = 1 hour 30 minutes = 90 minutes, 1 hr 10 min = 70 minutes (1 hour = 60 minutes) - Draw a bar of the appropriate height above the type of each exercise on the X-axis.
RELATED QUESTIONS
This bar graph shows the maximum temperatures in degrees Celsius in different cities on a certain day in February. Observe the graph and answer the questions.

- What data is shown on the vertical and the horizontal lines?
- Which city had the highest temperature?
- Which cities had equal maximum temperatures?
- Which cities had a maximum temperature of 30° C?
- What is the difference between the maximum temperatures of Panchgani and Chandrapur?
The names and numbers of animals in a certain zoo are given below. Use the data to make a bar graph. (Scale : on Y - axis, 1cm = 4 animals)
| Animals | Deer | Tiger | Monkey | Rabbit | Peacock |
| Number | 20 | 4 | 12 | 16 | 8 |
The number of customers who came to a juice centre for one week is given in the table below. Make two different bar graphs to show this data. (Scale: on Y-axis, 1cm = 10 customers, on Y - axis, 1cm = 5 customers)
| Type of juice | Orange | Pineapple | Apple | Mango | Pomegranate |
| No. of Customers | 50 | 30 | 25 | 65 | 10 |
Chitra has to buy Laddus in order to distribute to her friends as follow: Draw a Bar Graph for this data
| Classes | VI | VII | VIII | IX | X |
| Number of Laddus | 70 | 60 | 45 | 80 | 55 |
The pictograph below gives the number of absentees on different days of the week in class six. Draw the Bar graph for the same.
| Day | Monday | Tuesday | Wednesday | Thursday | Friday | Saturday |
| Number of Absentees |  |
 |
 |
 |
-- |  |
represents 4 students represents 2 students
A bar graph can be drawn using ______________
The cost of a notebook is Rs 10. Draw a graph after making a table showing cost of 2, 3, 4, .... notebooks. Use it to find the number of note books that can be purchased with Rs 50
Draw a graph for the radius and circumference of circle using a suitable scale.
(Hint: Take radius = 7, 14, 21 units and so on)
From the graph,
- Find the circumference of the circle when radius is 42 units.
- At what radius will the circumference of the circle be 220 units?
The number of ATMs of different banks in a city is shown below:
| Bank | Number of ATMs |
| Syndicate Bank | 5 |
| Dena Bank | 15 |
| Indian Bank | 20 |
| State Bank of India | 25 |
| Vijaya Bank | 10 |
Draw a bar graph to represent the above information by choosing the scale of your choice.
In a botanical garden, the number of different types of plants are found as follows:
| Type of the plants | Number of plants |
| Herb | 50 |
| Shrub | 60 |
| Creeper | 20 |
| Climber | 45 |
| Tree | 95 |
Draw a bar graph to represent the above information and answer the following questions:
(a) Which type of plant is maximum in number in the garden?
(b) Which type of plant is minimum in number in the garden?
