Advertisements
Advertisements
Question
In a botanical garden, the number of different types of plants are found as follows:
| Type of the plants | Number of plants |
| Herb | 50 |
| Shrub | 60 |
| Creeper | 20 |
| Climber | 45 |
| Tree | 95 |
Draw a bar graph to represent the above information and answer the following questions:
(a) Which type of plant is maximum in number in the garden?
(b) Which type of plant is minimum in number in the garden?
Solution
In order to construct a bar graph representing the above data, we follow the following steps:
Step I: Take a graph paper and draw two mutually perpendicular lines OX and Oy. Let OX as the horizontal axis and OY as the vertical axis.
Step II: Along OX, mark type of the plant and along OY, mark number of plants.
Step III: Choose a suitable scale to determine the heights of the bars, according to the availability of space. Here, we choose 1 unit length represents 10 plants.
Step IV: Calculate the height of various bars as follows
| Type of the plants | Height of bars |
| Herb | `50/10` = 5 units |
| Shrub | `60/10` = 6 units |
| Creeper | `20/10` = 2 units |
| Climber | `45/10` = 4.5 units |
| Tree | `95/10` = 9.5 units |
Hence, the required bar graph for the given data is shown below
Scale: 1 unit length = 10 plants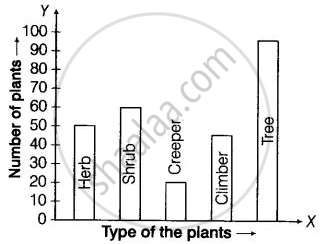
(a) On studying bar graph, tree is maximum in number in the garden.
(b) On studying bar graph, creeper plants is minimum in number in the garden.
APPEARS IN
RELATED QUESTIONS
Write the names of four of your classmates. Beside each name, write his/her weight in kilograms. Enter this data in a table like the above and make a bar graph.
A bar graph can be drawn using ______________
The bar graph illustrates the results of a survey conducted on vehicles crossing over a Toll Plaza in one hour.
Observe the bar graph carefully and fill up the following table.
| Vehicles | Buses | _____ | Cars | Vans | _____ | Others | Total vehicles |
| Number of Vehicles |
_____ | 45 | _____ | _____ | 30 | ______ | ______ |
The lengths (in the nearest centimetre) of 30 drumsticks are given as follows.
| Lengths | Number of drumsticks |
| 24 | |||| |
| 25 | -- |
| 26 | -- |
| 27 | |||| | |
| 28 | -- |
| 29 | |||| ||| |
| 30 | |||| | |
| 31 | |||| |
Draw the bar graph showing the same information.
The horizontal and vertical line in a line graph are usually called ______ and ______.
The cost of a note book is Rs 10. Draw a graph after making a table showing cost of 2, 3, 4, .... note books. Use it to find
- the cost of 7 notebooks.
- the number of note books that can be purchased with Rs 50.
The following table gives the data of number of schools (stage-wise) of a country in the year 2002.
| Stage | Number of schools (in thousands) |
| Primary | 80 |
| Upper Primary | 55 |
| Secondary | 30 |
| Higher Secondary | 20 |
Draw a bar graph to represent the above data:
The number of Mathematics books sold by a shopkeeper on six consecutive days is shown below:
| Days | Sunday | Monday | Tuesday | Wednesday | Thursday | Friday |
| Number of books sold |
65 | 40 | 30 | 50 | 20 | 70 |
Draw a bar graph to represent the above information choosing the scale of your choice.
The following table shows the number of bicycles manufactured in a factory from the years 1998 to 2002. Illustrate this data using a bar graph. Choose a scale of your choice.
| Years | Number of bicycles manufactured |
| 1998 | 800 |
| 1999 | 600 |
| 2000 | 900 |
| 2001 | 1100 |
| 2002 | 1200 |
- In which year was the maximum number of bicycles manufactured?
- In which year was the minimum number of bicycles manufactured?
The number of people in various age groups in a town is given in the following table.
| Age group | 1-14 | 15-29 | 30-44 | 45-59 | 60-74 | 75 and above |
| Number of persons | 2 lakhs |
1 lakh |
1 lakh |
1 lakh |
80 thousand | 40 thousand |
Draw a bar graph to represent the above information and answer the following questions. (take 1 unit length = 20 thousands)
- Which two age groups have the same population?
- All persons in the age group of 60 and above are called senior citizens. How many senior citizens are there in the town?
