Advertisements
Advertisements
Question
Home appliances sold by a shop in one month are given as below:
| Home appliance | Number of home appliances |
| Refrigerator | 75 |
| Television | 45 |
| Washing Machine | 30 |
| Cooler | 60 |
| DVD Player | 30 |
Draw a bar graph to represent the above information.
Solution
In order to draw a bar graph representing the above data, we follow the following steps:
Step I: Take a graph paper and draw two mutually perpendicular lines OX and OY. Let OX as the horizontal axis and OY as the vertical axis.
Step II: Along OX, mark of home appliances and along OY, mark number of appliances.
Step III: Choose a suitable scale to determine the heights of the bars, according to the availability of space. Here, we choose 1 unit length represents 10 home appliances.
Step IV: Calculate the height of various bars as follows
| Home appliance | Height of bars |
| Refrigerator | `75/10` = 7.5 units |
| Television | `45/10` = 4.5 units |
| Washing Machine | `30/10` = 3 units |
| Cooler | `60/10` = 6 units |
| DVD Player | `30/10` = 3 units |
Hence, the required bar graph for the given data is shown below
Scale: 1 unit length = 10 home appliances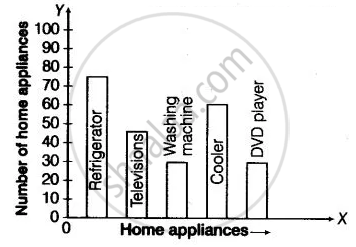
APPEARS IN
RELATED QUESTIONS
Students planted trees in 5 villages of Sangli district. Make a bar graph of this data. (Scale: on Y-axis, 1cm = 100 trees)
| Name of place | Dudhgaon | Bagni | Samdoli | Ashta | Kavathepiran |
| No. of trees planted | 500 | 350 | 600 | 420 | 540 |
Write the names of four of your classmates. Beside each name, write his/her weight in kilograms. Enter this data in a table like the above and make a bar graph.
The following data gives total marks (out of 600) obtained by six children of a particular class. Represent the data on a bar graph.
| Students | Ajay | Bali | Dipti | Faiyaz | Geetika | Hari |
| Marks Obtained | 450 | 500 | 300 | 360 | 400 | 540 |
Chitra has to buy Laddus in order to distribute to her friends as follow: Draw a Bar Graph for this data
| Classes | VI | VII | VIII | IX | X |
| Number of Laddus | 70 | 60 | 45 | 80 | 55 |
A bar graph can be drawn using ______________
Data was collected on a student’s typing rate and graph was drawn as shown below. Approximately how many words had this student typed in 30 seconds?

Complete the given table and draw a graph.
| x | 0 | 1 | 2 | 3 |
| y = 3x + 1 | 1 | 4 | - | - |
Draw a graph for the radius and circumference of circle using a suitable scale.
(Hint: Take radius = 7, 14, 21 units and so on)
From the graph,
- Find the circumference of the circle when radius is 42 units.
- At what radius will the circumference of the circle be 220 units?
A survey of 120 school students was done to find which activity they prefer to do in their free time.
| Preferred activity | Number of students |
| Playing | 45 |
| Reading story books | 30 |
| Watching TV | 20 |
| Listening to music | 10 |
| Painting | 15 |
Draw a bar graph to illustrate the above data taking a scale of 1 unit length = 5 students.
Which activity is preferred by most of the students other than playing?
The following table shows the number of bicycles manufactured in a factory from the years 1998 to 2002. Illustrate this data using a bar graph. Choose a scale of your choice.
| Years | Number of bicycles manufactured |
| 1998 | 800 |
| 1999 | 600 |
| 2000 | 900 |
| 2001 | 1100 |
| 2002 | 1200 |
- In which year was the maximum number of bicycles manufactured?
- In which year was the minimum number of bicycles manufactured?
