Advertisements
Advertisements
Question
Chitra has to buy Laddus in order to distribute to her friends as follow: Draw a Bar Graph for this data
| Classes | VI | VII | VIII | IX | X |
| Number of Laddus | 70 | 60 | 45 | 80 | 55 |
Solution
Distribution of Laddus by Chitra to her friends
Scale: 1 unit = 10 Laddus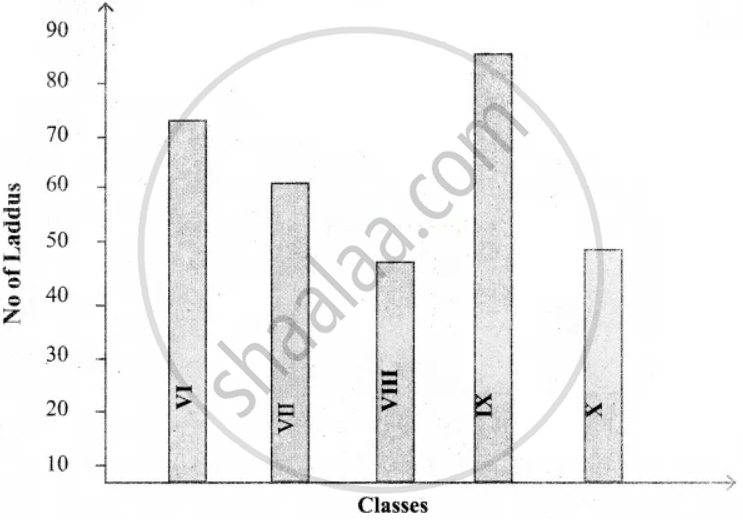
APPEARS IN
RELATED QUESTIONS
The fruits liked by the students of a class are as follow: Draw a Bar Graph for this data.
| Fruits | Bananas | Grapes | Apples | Mangoes | Guavas | Papayas | Other fruits |
| Number of students |
8 | 10 | 8 | 7 | 12 | 3 | 2 |
The lengths (in the nearest centimetre) of 30 drumsticks are given as follows.
| Lengths | Number of drumsticks |
| 24 | |||| |
| 25 | -- |
| 26 | -- |
| 27 | |||| | |
| 28 | -- |
| 29 | |||| ||| |
| 30 | |||| | |
| 31 | |||| |
Draw the bar graph showing the same information.
The cost of a notebook is Rs 10. Draw a graph after making a table showing cost of 2, 3, 4, .... notebooks. Use it to find the number of note books that can be purchased with Rs 50
Draw a graph for the radius and circumference of circle using a suitable scale.
(Hint: Take radius = 7, 14, 21 units and so on)
From the graph,
- Find the circumference of the circle when radius is 42 units.
- At what radius will the circumference of the circle be 220 units?
The number of ATMs of different banks in a city is shown below:
| Bank | Number of ATMs |
| Syndicate Bank | 5 |
| Dena Bank | 15 |
| Indian Bank | 20 |
| State Bank of India | 25 |
| Vijaya Bank | 10 |
Draw a bar graph to represent the above information by choosing the scale of your choice.
The following table represents income of a Gram Panchayat from different sources in a particular year:
| Sources | Income (in Rs.) |
| Income from local taxes | 75000 |
| Funds received from government | 150000 |
| Donations | 25000 |
| Income from other resources | 50000 |
Draw a bar graph to represent the above information.
The following table gives the data of number of schools (stage-wise) of a country in the year 2002.
| Stage | Number of schools (in thousands) |
| Primary | 80 |
| Upper Primary | 55 |
| Secondary | 30 |
| Higher Secondary | 20 |
Draw a bar graph to represent the above data:
A survey of 120 school students was done to find which activity they prefer to do in their free time.
| Preferred activity | Number of students |
| Playing | 45 |
| Reading story books | 30 |
| Watching TV | 20 |
| Listening to music | 10 |
| Painting | 15 |
Draw a bar graph to illustrate the above data taking a scale of 1 unit length = 5 students.
Which activity is preferred by most of the students other than playing?
The number of Mathematics books sold by a shopkeeper on six consecutive days is shown below:
| Days | Sunday | Monday | Tuesday | Wednesday | Thursday | Friday |
| Number of books sold |
65 | 40 | 30 | 50 | 20 | 70 |
Draw a bar graph to represent the above information choosing the scale of your choice.
The following table shows the number of bicycles manufactured in a factory from the years 1998 to 2002. Illustrate this data using a bar graph. Choose a scale of your choice.
| Years | Number of bicycles manufactured |
| 1998 | 800 |
| 1999 | 600 |
| 2000 | 900 |
| 2001 | 1100 |
| 2002 | 1200 |
- In which year was the maximum number of bicycles manufactured?
- In which year was the minimum number of bicycles manufactured?
