Advertisements
Advertisements
Question
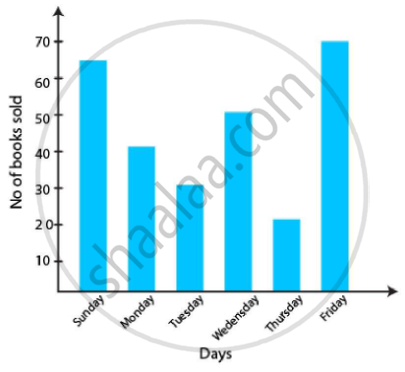
The number of Mathematics books sold by a shopkeeper on six consecutive days is shown below:
| Days | Sunday | Monday | Tuesday | Wednesday | Thursday | Friday |
| Number of books sold |
65 | 40 | 30 | 50 | 20 | 70 |
Draw a bar graph to represent the above information choosing the scale of your choice.
Solution
By taking a scale of 1 unit length = 10 books, we may draw a bar graph of the above data as follows:
APPEARS IN
RELATED QUESTIONS
The names of the heads of some families in a village and the quantity of drinking water their family consumes in one day are given below. Draw a bar graph for this data.
(Scale: On Y-axis, 1cm = 10 litres of water)
| Name | Ramesh | Shobha | Ayub | Julie | Rahul |
| Litres of water used | 30 litres | 60 litres | 40 litres | 50 litres | 55 litres |
The table below gives the number of children who took part in the various items of the talent show as part of the annual school gathering. Make a bar graph to show this data.
(Scale: on Y-axis, 1cm = 4 children)
| Programme | Theatre | Dance | Vocal music | Instrumental music | One-act plays |
| No. of students | 24 | 40 | 16 | 8 | 4 |
The number of customers who came to a juice centre for one week is given in the table below. Make two different bar graphs to show this data. (Scale: on Y-axis, 1cm = 10 customers, on Y - axis, 1cm = 5 customers)
| Type of juice | Orange | Pineapple | Apple | Mango | Pomegranate |
| No. of Customers | 50 | 30 | 25 | 65 | 10 |
Chitra has to buy Laddus in order to distribute to her friends as follow: Draw a Bar Graph for this data
| Classes | VI | VII | VIII | IX | X |
| Number of Laddus | 70 | 60 | 45 | 80 | 55 |
The fruits liked by the students of a class are as follow: Draw a Bar Graph for this data.
| Fruits | Bananas | Grapes | Apples | Mangoes | Guavas | Papayas | Other fruits |
| Number of students |
8 | 10 | 8 | 7 | 12 | 3 | 2 |
The lengths (in the nearest centimetre) of 30 drumsticks are given as follows.
| Lengths | Number of drumsticks |
| 24 | |||| |
| 25 | -- |
| 26 | -- |
| 27 | |||| | |
| 28 | -- |
| 29 | |||| ||| |
| 30 | |||| | |
| 31 | |||| |
Draw the bar graph showing the same information.
The bar chart represents the number of students using different modes of transport. Observe and answer the following questions.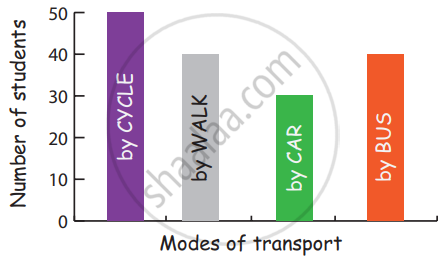
Questions
a. Which mode of transport is mostly used by the students? _____________
b. How many students come to school by walk? ____________
c. Which mode of transport is used the least? ____________
d. How many students come to school by bus? ____________
The cost of a notebook is Rs 10. Draw a graph after making a table showing cost of 2, 3, 4, .... notebooks. Use it to find the number of note books that can be purchased with Rs 50
Complete the given table and draw a graph.
| x | 0 | 1 | 2 | 3 |
| y = 3x + 1 | 1 | 4 | - | - |
In a botanical garden, the number of different types of plants are found as follows:
| Type of the plants | Number of plants |
| Herb | 50 |
| Shrub | 60 |
| Creeper | 20 |
| Climber | 45 |
| Tree | 95 |
Draw a bar graph to represent the above information and answer the following questions:
(a) Which type of plant is maximum in number in the garden?
(b) Which type of plant is minimum in number in the garden?
