Advertisements
Chapters
![NCERT Exemplar solutions for Mathematics [English] Class 6 chapter 5 - Data Handling - Shaalaa.com](/images/mathematics-english-class-6_6:5f2b1b2038084cf381bfa42c826a928c.jpg "NCERT Exemplar solutions for Mathematics [English] Class 6 chapter 5 - Data Handling")
Advertisements
Solutions for Chapter 5: Data Handling
Below listed, you can find solutions for Chapter 5 of CBSE NCERT Exemplar for Mathematics [English] Class 6.
NCERT Exemplar solutions for Mathematics [English] Class 6 5 Data Handling Exercise [Pages 72 - 87]
Choose the correct alternative:
Using tally marks, which one of the following represents the number eight:

`cancel(bb|bb|bb|)` `cancel(bb|bb|bb|)`
`cancel(bb|bb|bb|bb|bb|)` ||
`cancel(bb|bb|bb|bb|)` |||
The marks (out of 10) obtained by 28 students in a Mathematics test are listed as below:
8, 1, 2, 6, 5, 5, 5, 0, 1, 9, 7, 8, 0, 5, 8, 3, 0, 8, 10, 10, 3, 4, 8, 7, 8, 9, 2, 0
The number of students who obtained marks more than or equal to 5 is ______.
13
15
16
17
In this question, the number of students who scored marks less than 4 is ______.
8, 1, 2, 6, 5, 5, 5, 0, 1, 9, 7, 8, 0, 5, 8, 3, 0, 8, 10, 10, 3, 4, 8, 7, 8, 9, 2, 0
15
13
12
10
The choices of the fruits of 42 students in a class are as follows:
A, O, B, M, A, G, B, G, A, G, B, M, A, G, M, A, B, G, M, B, A, O, M, O, G, B, O, M, G, A, A, B, M, O, M, G, B, A, M, O, M, O, where A, B, G, M and O stand for the fruits Apple, Banana, Grapes, Mango and Orange respectively. Which two fruits are liked by an equal number of students?
A and M
M and B
B and O
B and G
According to data of question 4, which fruit is liked by most of the students?
O
G
M
A
State whether the following is True or False:
In a bar graph, the width of bars may be unequal.
True
False
In a bar graph, bars of uniform width are drawn vertically only.
True
False
In a bar graph, the gap between two consecutive bars may not be the same.
True
False
In a bar graph, each bar (rectangle) represents only one value of the numerical data.
True
False
To represent the population of different towns using bar graph, it is convenient to take one unit length to represent one person.
True
False
Pictographs and bar graphs are pictorial representations of the numerical data.
True
False
An observation occurring five times in a data is recorded as | | | | |, using tally marks.
True
False
In a pictograph, if a symbol ![]() represents 50 books in a library shelf, then the symbol
represents 50 books in a library shelf, then the symbol ![]() represents 25 books.
represents 25 books.
True
False
Fill in the blank:
A ______ is a collection of numbers gathered to give some meaningful information.
The data can be arranged in a tabular form using ______ marks.
A ______ represents data through pictures of objects.
In a bar graph, ______ can be drawn horizontally or vertically.
In a bar graph, bars of ______ width can be drawn horizontally or vertically with ______ spacing between them.
An observation occurring seven times in a data is represented as ______ using tally marks.
In a pictograph, if a symbol ![]() represents 20 flowers in a basket then
represents 20 flowers in a basket then ![]() stands for ______ flowers.
stands for ______ flowers.
On the scale of 1 unit length = 10 crore, the bar of length 6 units will represent ______ crore and of ______ units will represent 75 crore.
In an examination, the grades achieved by 30 students of a class are given below. Arrange these grades in a table using tally marks:
B, C, C, E, A, C, B, B, D, D, D, D, B, C, C, C, A, C, B, E, A, D, C, B, E, C, B, E, C, D
The number of two wheelers owned individually by each of 50 families are listed below. Make a table using tally marks.
1, 1, 2, 1, 1, 1, 2, 1, 2, 1, 0, 1, 1, 2, 3, 1, 2, 1, 1, 2, 1, 2, 3, 1, 0, 2, 1, 0, 2, 1, 2, 1, 2, 1, 1, 4, 1, 3, 1, 1, 2, 1, 1, 1, 1, 2, 3, 2, 1, 1
Find the number of families having two or more, two wheelers.
The lengths in centimetres (to the nearest centimetre) of 30 carrots are given as follows:
15, 22, 21, 20, 22,15, 15, 20, 20,15, 20, 18, 20, 22, 21,
20, 21, 18, 21, 18, 20, 18, 21, 18, 22, 20, 15, 21, 18, 20
Arrange the data given above in a table using tally marks and answer the following questions.
(a) What is the number of carrots which have length more than 20 cm?
(b) Which length of the carrots occur maximum number of times? Minimum number of times?
Thirty students were interviewed to find out what they want to be in future. Their responses are listed as below:
doctor, engineer, doctor, pilot, officer, doctor, engineer, doctor, pilot, officer, pilot, engineer, officer, pilot, doctor, engineer, pilot, officer, doctor, officer, doctor, pilot, engineer, doctor, pilot, officer, doctor, pilot, doctor, engineer
Arrange the data in a table using tally marks.
Following are the choices of games of 40 students of Class VI:
football, cricket, football, kho-kho, hockey, cricket, hockey, kho-kho, tennis, tennis, cricket, football, football, hockey, kho-kho, football, cricket, tennis, football, hockey, kho-kho, football, cricket, cricket, football, hockey, kho-kho, tennis, football, hockey, cricket, football, hockey, cricket, football, kho-kho, football, cricket, hockey, football.
(a) Arrange the choices of games in a table using tally marks.
(b) Which game is liked by most of the students?
(c) Which game is liked by minimum number of students?
Fill in the blanks in the following table which represents shirt size of 40 students of a school.
| Shirt size | Tally Marks | Number of students |
| 30 | ||| | 3 |
| 32 | `cancel(bb|bb|bb|bb|)` | ______ |
| 34 | ______ | 8 |
| 36 | `cancel(bb|bb|bb|bb|)` || | ______ |
| 38 | `cancel(bb|bb|bb|bb|)` ______ | 10 |
| 40 | ______ | 7 |
Following pictograph represents some surnames of people listed in the telephone directory of a city
| Surname | Number of people |
| Khan |  |
| Patel |  |
| Rao |  |
| Roy |  |
| Saikia |  |
| Singh |  |
Observe the pictograph and answer the following questions:
(a) How many people have surname ‘Roy’?
(b) Which surname appears the maximum number of times in the telephone directory?
(c) Which surname appears the least number of times in the directory?
(d) Which two surnames appear an equal number of times?
Students of Class VI in a school were given a task to count the number of articles made of different materials in the school. The information collected by them is represented as follows:
| Material used | Articles |
| Wood |  |
| Glass |  |
| Metal |  |
| Rubber |  |
| Plastic |  |
Observe the pictograph and answer the following questions:
(a) Which material is used in maximum number of articles?
(b) Which material is used in minimum number of articles?
(c) Which material is used in exactly half the number of articles as those made up of metal?
(d) What is the total number of articles counted by the students?
The number of scouts in a school is depicted by the following pictograph:
| Class | Number of scouts |
| VI |  |
| VII |  |
| VIII |  |
| IX |  |
| X |  |
Observe the pictograph and answer the following questions:
(a) Which class has the minimum number of scouts?
(b) Which class has the maximum number of scouts?
(c) How many scouts are there in Class VI?
(d) Which class has exactly four times the scouts as that of Class X?
(e) What is the total number of scouts in the Classes VI to X?
A survey was carried out in a certain school to find out the popular school subjects among students of Classes VI to VIII. The data in this regard is displayed as pictograph given below:
| Subject | Number of Students |
| Hindi | |
| English | |
| Mathematics | |
| Science | |
| Social Studies |
(a) Which subject is most popular among the students?
(b) How many students like Mathematics?
(c) Find the number of students who like subjects other than Mathematics and Science.
The following pictograph depicts the information about the areas in sq km (to nearest hundred) of some districts of Chhattisgarh State:
| District | Area (in km2) |
| Raigarh |  |
| Rajnandgaon |  |
| Koria |  |
| Mahasamund |  |
| Kabirdham |  |
| Jashpur |  |
(a) What is the area of Koria district?
(b) Which two districts have the same area?
(c) How many districts have area more than 5000 square kilometres?
The number of bottles of cold drinks sold by a shopkeeper on six consecutive days is as follows:
| Day | Sunday | Monday | Tuesday | Wednesday | Thursday | Friday |
| Number of bottles | 350 | 200 | 300 | 250 | 100 | 150 |
Prepare a pictograph of the data using one symbol to represent 50 bottles.
The following table gives information about the circulation of newspapers (dailies) in a town in five languages.
| Language | English | Hindi | Tamil | Punjabi | Gujarati |
| Number of newspapers |
5000 | 8500 | 500 | 2500 | 1000 |
Prepare a pictograph of the above data, using a symbol of your choice, each representing 1000 newspapers.
Annual expenditure of a company in the year 2007-2008 is given below:
| Items | Expenditure (Rs in lakh) |
| Salaries of employees | 65 |
| Advertisement | 10 |
| Purchase of machiner | 85 |
| Electricity and water | 15 |
| Transportation | 25 |
| Other expenses | 30 |
Prepare a pictograph of the above data using an appropriate symbol to represent Rs 10 lakh.
The following bar graph shows the number of houses (out of 100) in a town using different types of fuels for cooking.
Read the bar graph and answer the following questions:
Scale: 1 unit length = 5 houses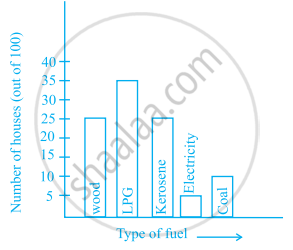
(a) Which fuel is used in maximum number of houses?
(b) How many houses are using coal as fuel?
(c) Suppose that the total number of houses in the town is 1 lakh.
From the above graph estimate the number of houses using electricity.
The following bar graph represents the data for different sizes of shoes worn by the students in a school. Read the graph and answer the following questions.
Scale: 1 unit length = 50 students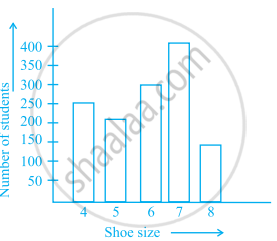
(a) Find the number of students whose shoe sizes have been collected.
(b) What is the number of students wearing shoe size 6?
(c) What are the different sizes of the shoes worn by the students?
(d) Which shoe size is worn by the maximum number of students?
(e) Which shoe size is worn by minimum number of students?
(f) State whether true or false:
The total number of students wearing shoe sizes 5 and 8 is the same as the number of students wearing shoe size 6.
The following graph gives the information about the number of railway tickets sold for different cities on a railway ticket counter between 6.00 am to 10.00 am. Read the bar graph and answer the following questions.
Scale: 1 unit length = 10 tickets
(a) How many tickets were sold in all?
(b) For which city were the maximum number of tickets sold?
(c) For which city were the minimum number of tickets sold?
(d) Name the cities for which the number of tickets sold is more than 20
(e) Fill in the blanks: Number of tickets sold for Delhi and Jaipur together exceeds the total number of tickets sold for Patna and Chennai by ______.
The bar graph given below represents approximate length (in kilometres) of some National Highways in India. Study the bar graph and answer the following questions:
Scale: 1 unit length = 200 km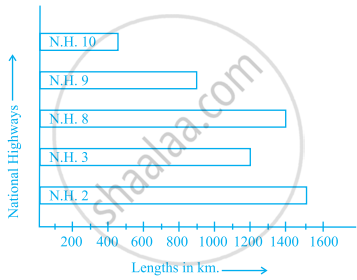
(a) Which National Highway (N.H.) is the longest among the above?
(b) Which National Highway is the shortest among the above?
(c) What is the length of National Highway 9?
(d) Length of which National Highway is about three times the National Highway10?
The bar graph given below represents the circulation of newspapers in different languages in a town. Study the bar graph and answer the following questions:
Scale: 1 unit length = 200 Newspapers
(a) What is the circulation of English newspaper?
(b) Name the two languages in which circulation of newspaper is the same.
(c) By how much is the circulation of newspaper in Hindi more than the newspaper in Bengali?
Read the bar graph given below and answer the following questions:
Scale: 1 unit = 50 students
(a) What information is given by the bar graph?
(b) In which year is the number of students maximum?
(c) In which year is the number of students twice as that of 2001 – 02?
(d) In which year did the number of students decrease as compared to previous year?
(e) In which year is the increase in number of students maximum as compared to the previous year?
The lengths in km (rounded to nearest hundred) of some major rivers of India is given below
| River | Length (in km) |
| Narmada | 1300 |
| Mahanadi | 900 |
| Brahmputra | 2900 |
| Ganga | 2500 |
| Kaveri | 800 |
| Krishna | 1300 |
Draw a bar graph to represent the above information.
The number of ATMs of different banks in a city is shown below:
| Bank | Number of ATMs |
| Syndicate Bank | 5 |
| Dena Bank | 15 |
| Indian Bank | 20 |
| State Bank of India | 25 |
| Vijaya Bank | 10 |
Draw a bar graph to represent the above information by choosing the scale of your choice.
Number of mobile phone users in various age groups in a city is listed below:
| Age group (in years) | Number of mobile users |
| 1 – 20 | 25000 |
| 21 – 40 | 40000 |
| 41 – 50 | 35000 |
| 61 – 80 | 10000 |
Draw a bar graph to represent the above information.
The following table gives the number of vehicles passing through a toll gate, every hour from 8.00 am. to 1.00 pm:
| Time Interval |
8.00 to 9.00 |
9.00 to 10.00 |
10.00 to 11.00 |
11.00 to 12.00 |
12.00 to 1.00 |
| Number of vehicles |
250 | 450 | 300 | 250 | 150 |
Draw a bar graph representing the above data.
The following table represents income of a Gram Panchayat from different sources in a particular year:
| Sources | Income (in Rs.) |
| Income from local taxes | 75000 |
| Funds received from government | 150000 |
| Donations | 25000 |
| Income from other resources | 50000 |
Draw a bar graph to represent the above information.
The following table gives the data of number of schools (stage-wise) of a country in the year 2002.
| Stage | Number of schools (in thousands) |
| Primary | 80 |
| Upper Primary | 55 |
| Secondary | 30 |
| Higher Secondary | 20 |
Draw a bar graph to represent the above data:
Home appliances sold by a shop in one month are given as below:
| Home appliance | Number of home appliances |
| Refrigerator | 75 |
| Television | 45 |
| Washing Machine | 30 |
| Cooler | 60 |
| DVD Player | 30 |
Draw a bar graph to represent the above information.
In a botanical garden, the number of different types of plants are found as follows:
| Type of the plants | Number of plants |
| Herb | 50 |
| Shrub | 60 |
| Creeper | 20 |
| Climber | 45 |
| Tree | 95 |
Draw a bar graph to represent the above information and answer the following questions:
(a) Which type of plant is maximum in number in the garden?
(b) Which type of plant is minimum in number in the garden?
Prepare a bar graph of the data given in
| Surname | Number of people |
| Khan | |
| Patel | |
| Rao | |
| Roy | |
| Saikia | |
| Singh | |
Scale: 1 unit length = 200 km
Prepare a pictograph of the data by taking a suitable symbol to represent 200 kilometers.
Prepare a pictograph of the information given in
Scale: 1 unit length = 10 tickets
| Number of two wheelers |
Tally marks | Number of families |
| 0 | ||| | 3 |
| 1 | `cancel(|bb|bb|bb|)` `cancel(|bb|bb|bb|)` `cancel(|bb|bb|bb|)` `cancel(|bb|bb|bb|)` `cancel(|bb|bb|bb|)` ||| | 28 |
| 2 | `cancel(|bb|bb|bb|)` `cancel(|bb|bb|bb|)` |||| | 14 |
| 3 | |||| | 4 |
| 4 | | | 1 |
| Total | 50 |
Prepare a bar graph of the data.
The following table shows the area of the land on which different crops were grown.
| Crop | Area of land (in million hectares) |
| Rice | 50 |
| Wheat | 30 |
| Pulses | 20 |
| Sugarcane | 25 |
| Cotton | 15 |
Prepare a pictograph by choosing a suitable symbol to represent 10 million hectares.
| Crop | Area of land (in million hectares) |
| Rice | 50 |
| Wheat | 30 |
| Pulses | 20 |
| Sugarcane | 25 |
| Cotton | 15 |
Prepare a bar graph of the data.
Solutions for 5: Data Handling
NCERT Exemplar solutions for Mathematics [English] Class 6 chapter 5 - Data Handling
Shaalaa.com has the CBSE Mathematics Mathematics [English] Class 6 CBSE solutions in a manner that help students grasp basic concepts better and faster. The detailed, step-by-step solutions will help you understand the concepts better and clarify any confusion. NCERT Exemplar solutions for Mathematics Mathematics [English] Class 6 CBSE 5 (Data Handling) include all questions with answers and detailed explanations. This will clear students' doubts about questions and improve their application skills while preparing for board exams.
Further, we at Shaalaa.com provide such solutions so students can prepare for written exams. NCERT Exemplar textbook solutions can be a core help for self-study and provide excellent self-help guidance for students.
Concepts covered in Mathematics [English] Class 6 chapter 5 Data Handling are Concept of Data Handling, Recording Data, Organisation of Data, Concept of Pictograph, Interpretation of a Pictograph, Drawing a Pictograph, Concept of Bar Graph, Interpretation of Bar Graphs, Drawing a Bar Graph.
Using NCERT Exemplar Mathematics [English] Class 6 solutions Data Handling exercise by students is an easy way to prepare for the exams, as they involve solutions arranged chapter-wise and also page-wise. The questions involved in NCERT Exemplar Solutions are essential questions that can be asked in the final exam. Maximum CBSE Mathematics [English] Class 6 students prefer NCERT Exemplar Textbook Solutions to score more in exams.
Get the free view of Chapter 5, Data Handling Mathematics [English] Class 6 additional questions for Mathematics Mathematics [English] Class 6 CBSE, and you can use Shaalaa.com to keep it handy for your exam preparation.
