Advertisements
Advertisements
Question
In a bar graph, the width of bars may be unequal.
Options
True
False
Solution
This statement is False.
Explanation:
Since, a bar graph is a pictorial representation of the numerical data by a number of bars of uniform width erected horizontally or vertically with equal spacing between them.
APPEARS IN
RELATED QUESTIONS
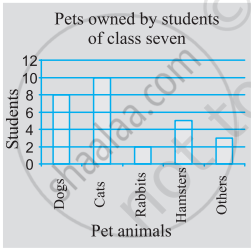
Use the bar graph (see the given figure) to answer the following question.

Which is the most popular pet?
Take the data giving the minimum and the maximum temperature of various cities given in the following table:
| Temperatures of the cities as on 20.6.2006 | ||
| City | Max. | Min. |
| Ahmedabad | 38ºC | 29ºC |
| Amritsar | 37ºC | 26ºC |
| Banglore | 28ºC | 21ºC |
| Chennai | 36ºC | 27ºC |
| Delhi | 38ºC | 28ºC |
| Jaipur | 39ºC | 29ºC |
| Jammu | 41ºC | 26ºC |
| Mumbai | 32ºC | 27ºC |
Plot a double bar graph using the data and answer the following:
- Which city has the largest difference in the minimum and maximum temperature on the given date?
- Which is the hottest city and which is the coldest city?
- Name two cities where maximum temperature of one was less than the minimum temperature of the other.
- Name the city which has the least difference between its minimum and the maximum temperature.
The following table shows the number of Buses and Trucks in nearest lakh units. Draw percentage bar-diagram. (Approximate the percentages to the nearest integer)
| Year | No. of Trucks | No. of Buses |
| 2005-2006 | 47 | 9 |
| 2007-2008 | 56 | 13 |
| 2008-2009 | 60 | 16 |
| 2009-2010 | 63 | 18 |
The following chart gives the growth in height in terms of percentage of full height of boys and girls with their respective ages.
| Age (in years) | 8 | 9 | 10 | 11 | 12 | 13 | 14 | 15 | 16 | 17 |
18 |
| Boys | 72% | 75% | 78% | 81% | 84% | 88% | 92% | 95% | 98% | 99% | 100% |
| Girls | 77% | 81% | 84% | 88% | 91% | 95% | 98% | 99% | 99.5% | 100% | 100% |
Draw the line graph of above data on the same sheet and answer the following questions.
- In which year both the boys and the girls achieve their maximum height?
- Who grows faster at puberty (14 years to 16 years of age)?
Use the bar graph (see the given figure) to answer the following question.

How many students have dog as a pet?
In a bar graph, ______ can be drawn horizontally or vertically.
Scale: 1 unit length = 200 km
Prepare a pictograph of the data by taking a suitable symbol to represent 200 kilometers.
Study the double bar graph given below and answer the questions that follow:

- What information is compared in the above given double bar graph?
- Calculate the ratio of minimum temperatures in the year 2008 to the year 2009 for the month of November.
- For how many months was the minimum temperature in the year 2008 greater than that of year 2009? Name those months.
- Find the average minimum temperature for the year 2008 for the four months.
- In which month is the variation in the two temperatures maximum?
Observe the following data:
| Government School, Chandpur | ||
| Daily Attendance | Date: 15.4.2009 | |
| Class | Total Students | Number of Students Present on that Day |
| VI | 90 | 81 |
| VII | 82 | 76 |
| VIII | 95 | 91 |
| IX | 70 | 65 |
| X | 63 | 62 |
- Draw a double bar graph choosing an appropriate scale. What do you infer from the bar graph?
- Which class has the maximum number of students?
- In which class, the difference of total students and number of students present is minimum?
- Find the ratio of number of students present to the total number of students of Class IX.
- What per cent of Class VI students were absent?
Observe the given data:
| Days of the week |
Mon | Tues | Wed | Thurs | Fri | Sat |
| Number of Mobile Phone Sets Sold |
50 | 45 | 30 | 55 | 27 | 60 |
- Draw a bar graph to represent the above given information.
- On which day of the week was the sales maximum?
- Find the total sales during the week.
- Find the ratio of the minimum sale to the maximum sale.
- Calculate the average sale during the week.
- On how many days of the week was the sale above the average sales?
