Advertisements
Advertisements
Question
In a bar graph, ______ can be drawn horizontally or vertically.
Solution
In a bar graph, bars can be drawn horizontally or vertically.
APPEARS IN
RELATED QUESTIONS
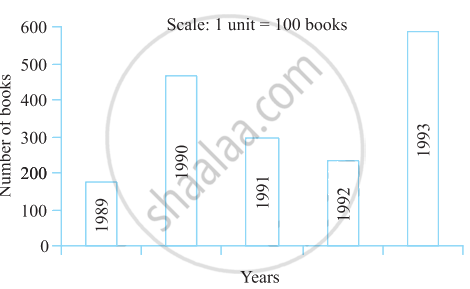
Read the bar graph (see the given figure) which shows the number of books sold by a bookstore during five consecutive years and answer the questions that follow:

- About how many books were sold in 1989? 1990? 1992?
- In which year were about 475 books sold? About 225 books sold?
- In which years were fewer than 250 books sold?
- Can you explain how you would estimate the number of books sold in 1989?
The performance of students in 1st Term and 2nd Term is given. Draw a double bar graph choosing appropriate scale and answer the following:
| Subject | English | Hindi | Maths | Science | S. science |
| 1st Term (M.M. 100) | 67 | 72 | 88 | 81 | 73 |
| 2nd Term (M.M. 100) | 70 | 65 | 95 | 85 | 75 |
- In which subject, has the child improved his performance the most?
- In which subject is the improvement the least?
- Has the performance gone down in any subject?
The following table shows the number of Buses and Trucks in nearest lakh units. Draw percentage bar-diagram. (Approximate the percentages to the nearest integer)
| Year | No of trucks | No of buses |
| 2005-2006 2007-2008 2008-2009 2009-2010 |
47 56 60 63 |
9 13 16 18 |
In the table given below, the information is given about roads. Using this draw a sub-divided and percentage bar diagram (Approximate the percentages to the nearest integer).
| Year | Permanent Roads ( Lakh km.) |
Temporary Roads ( Lakh km.) |
| 2000-2001 | 14 | 10 |
| 2001-2002 | 15 | 11 |
| 2002-2003 | 17 | 13 |
| 2003-2004 | 20 | 19 |
Try yourself
On any one day, choose any three cities and record their temperature from the TV or newspaper.
- Make a bar chart in your notebook and ask your friends a few questions about it. See if they understand your chart!
In a bar graph, bars of uniform width are drawn vertically only.
The following table gives the number of vehicles passing through a toll gate, every hour from 8.00 am. to 1.00 pm:
| Time Interval |
8.00 to 9.00 |
9.00 to 10.00 |
10.00 to 11.00 |
11.00 to 12.00 |
12.00 to 1.00 |
| Number of vehicles |
250 | 450 | 300 | 250 | 150 |
Draw a bar graph representing the above data.
| Crop | Area of land (in million hectares) |
| Rice | 50 |
| Wheat | 30 |
| Pulses | 20 |
| Sugarcane | 25 |
| Cotton | 15 |
Prepare a bar graph of the data.
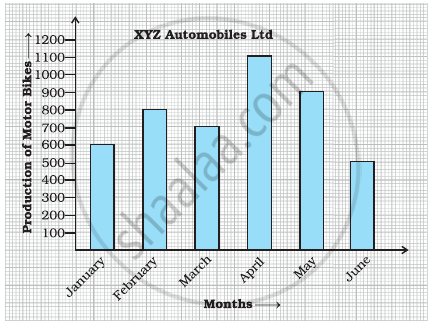
Observe the given bar graph carefully and answer the questions that follow.
- What information does the bar graph depict?
- How many motor bikes were produced in the first three months?
- Calculate the increase in production in May over the production in January.
- In which month the production was minimum and what was it?
- Calculate the average (mean) production of bikes in 6 months.
The marks out of 100 obtained by Kunal and Soni in the Half Yearly Examination are given below:
| Subjects | English | Hindi | Maths | Science | S. Science | Sanskirt |
| Kunal | 72 | 81 | 92 | 96 | 64 | 85 |
| Soni | 86 | 89 | 90 | 82 | 75 | 82 |
- Draw a double bar graph by choosing appropriate scale.
- Calculate the total percentage of marks obtained by Soni.
- Calculate the total percentage of marks obtained by Kunal.
- Compare the percentages of marks obtained by Kunal and Soni.
- In how many subjects did Soni get more marks than Kunal? Which are those subjects?
- Who got more marks in S. Science and what was the difference of marks?
- In which subject the difference of marks was maximum and by how much?
