Advertisements
Advertisements
Question
The following table gives the number of vehicles passing through a toll gate, every hour from 8.00 am. to 1.00 pm:
| Time Interval |
8.00 to 9.00 |
9.00 to 10.00 |
10.00 to 11.00 |
11.00 to 12.00 |
12.00 to 1.00 |
| Number of vehicles |
250 | 450 | 300 | 250 | 150 |
Draw a bar graph representing the above data.
Solution
In order to construct a bar graph representing the above data, we follow the following steps:
Step I: Take a graph paper and draw two mutually perpendicular lines OX and Oy. Let OX as the horizontal axis and OY as the vertical axis.
Step II: Along OX, mark time interval and along OY, mark number of vehicles.
Step III: Along OX, choose the uniform (equal) width of the bars and the uniform gap between them, according to the space available for the graph.
Step IV: Choose a suitable scale to determine the heights of the bars, according to the availability of space.
Here, we choose 1 unit length represents 50 vehicles.
| Time interval | Height of bars |
| 8.00 to 9.00 | `250/50` = 5 units |
| 9.00 to 10.00 | `450/50` = 9 units |
| 10.00 to 11.00 | `300/50` = 6 units |
| 11.00 to 12.00 | `250/50` = 5 units |
| 12.00 to 1.00 | `150/50` = 3 units |
Hence, the required bar graph for the given data is shown below
Scale: 1 unit length = 50 vehicles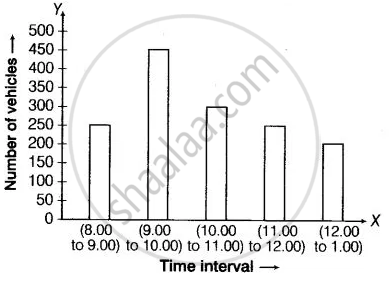
APPEARS IN
RELATED QUESTIONS
Read the bar graph (see the given figure) which shows the number of books sold by a bookstore during five consecutive years and answer the questions that follow:
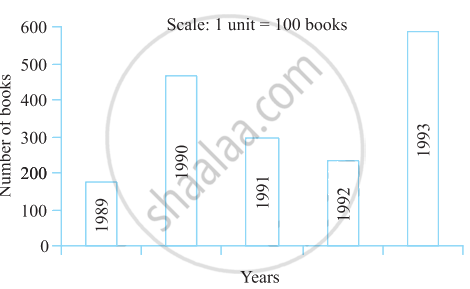
- About how many books were sold in 1989? 1990? 1992?
- In which year were about 475 books sold? About 225 books sold?
- In which years were fewer than 250 books sold?
- Can you explain how you would estimate the number of books sold in 1989?
Number of children in six different classes are given below. Represent the data on a bar graph.
| Class | Fifth | Sixth | Seventh | Eighth | Ninth | Tenth |
| Number of children | 135 | 120 | 95 | 100 | 90 | 80 |
- How would you choose a scale?
- Answer the following questions:
- Which class has the maximum number of children? And the minimum?
- Find the ratio of students of class sixth to the students of class eight.
Consider this data collected from a survey of a colony.
| Favourite sport | Cricket | Basket Ball | Swimming | Hockey | Athletics |
| Watching | 1240 | 470 | 510 | 430 | 250 |
| Participating | 620 | 320 | 320 | 250 | 105 |
- Draw a double bar graph choosing an appropriate scale. What do you infer from the bar graph?
- Which sport is most popular?
- Which is more preferred, watching or participating in sports?
Try yourself
On any one day, choose any three cities and record their temperature from the TV or newspaper.
- Make a bar chart in your notebook and ask your friends a few questions about it. See if they understand your chart!
In a bar graph, the width of bars may be unequal.
The following bar graph shows the number of houses (out of 100) in a town using different types of fuels for cooking.
Read the bar graph and answer the following questions:
Scale: 1 unit length = 5 houses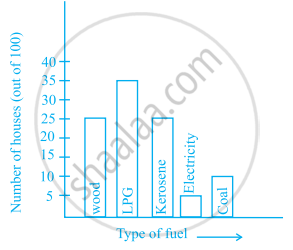
(a) Which fuel is used in maximum number of houses?
(b) How many houses are using coal as fuel?
(c) Suppose that the total number of houses in the town is 1 lakh.
From the above graph estimate the number of houses using electricity.
Scale: 1 unit length = 200 km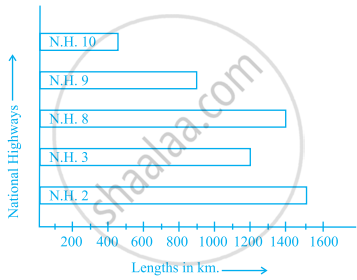
Prepare a pictograph of the data by taking a suitable symbol to represent 200 kilometers.
| Crop | Area of land (in million hectares) |
| Rice | 50 |
| Wheat | 30 |
| Pulses | 20 |
| Sugarcane | 25 |
| Cotton | 15 |
Prepare a bar graph of the data.
Study the double bar graph and answer the questions that follow:

- What information does the double bar graph represent?
- Find the total number of boys in all sections of Class VII.
- In which sections, the number of girls is greater than the number of boys?
- In which section, the number of boys is the maximum?
- In which section, the number of girls is the least?
The table below gives the data of tourists visiting 5 hill stations over two consecutive years. Study the table and answer the questions that follow:
| Hill stations | Nainital | Shimla | Manali | Mussoorie | Kullu |
| 2008 | 4000 | 5200 | 3700 | 5800 | 3500 |
| 2009 | 4800 | 4500 | 4200 | 6200 | 4600 |
- Draw a double bar graph to depict the above information using appropriate scale.
- Which hill station was visited by the maximum number of tourists in 2008?
- Which hill station was visited by the least number of tourists in 2009?
- In which hill stations was there increase in number of tourists in the year 2009?
