Topics
Rational Numbers
- Rational Numbers
- Closure Property of Rational Numbers
- Commutative Property of Rational Numbers
- Associative Property of Rational Numbers
- Distributive Property of Multiplication Over Addition for Rational Numbers
- Identity of Addition and Multiplication of Rational Numbers
- Negative Or Additive Inverse of Rational Numbers
- Concept of Reciprocal or Multiplicative Inverse
- Rational Numbers on a Number Line
- Rational Numbers Between Two Rational Numbers
Linear Equations in One Variable
- Variable of Equation
- Concept of Equation
- Expressions with Variables
- Balancing an Equation
- The Solution of an Equation
- Linear Equation in One Variable
- Solving Equations Which Have Linear Expressions on One Side and Numbers on the Other Side
- Some Applications Solving Equations Which Have Linear Expressions on One Side and Numbers on the Other Side
- Solving Equations Having the Variable on Both Sides
- Some More Applications on the Basis of Solving Equations Having the Variable on Both Sides
- Reducing Equations to Simpler Form
- Equations Reducible to the Linear Form
Understanding Quadrilaterals
- Concept of Curves
- Different Types of Curves - Closed Curve, Open Curve, Simple Curve.
- Concept of Polygons
- Classification of Polygons
- Properties of a Quadrilateral
- Interior Angles of a Polygon
- Exterior Angles of a Polygon and Its Property
- Concept of Quadrilaterals
- Properties of Trapezium
- Properties of Kite
- Properties of a Parallelogram
- Properties of Rhombus
- Property: The Opposite Sides of a Parallelogram Are of Equal Length.
- Property: The Opposite Angles of a Parallelogram Are of Equal Measure.
- Property: The adjacent angles in a parallelogram are supplementary.
- Property: The diagonals of a parallelogram bisect each other. (at the point of their intersection)
- Property: The diagonals of a rhombus are perpendicular bisectors of one another.
- Property: The Diagonals of a Rectangle Are of Equal Length.
- Properties of Rectangle
- Properties of a Square
- Property: The diagonals of a square are perpendicular bisectors of each other.
Practical Geometry
- Introduction to Geometric Tool
- Constructing a Quadrilateral When the Lengths of Four Sides and a Diagonal Are Given
- Constructing a Quadrilateral When Two Diagonals and Three Sides Are Given
- Constructing a Quadrilateral When Two Adjacent Sides and Three Angles Are Known
- Constructing a Quadrilateral When Three Sides and Two Included Angles Are Given
- Some Special Cases
Data Handling
- Concept of Data Handling
- Interpretation of a Pictograph
- Interpretation of Bar Graphs
- Drawing a Bar Graph
- Interpretation of a Double Bar Graph
- Drawing a Double Bar Graph
- Organisation of Data
- Frequency Distribution Table
- Graphical Representation of Data as Histograms
- Concept of Pie Graph (Or a Circle-graph)
- Interpretation of Pie Diagram
- Chance and Probability - Chance
- Basic Ideas of Probability
Squares and Square Roots
- Concept of Square Number
- Properties of Square Numbers
- Some More Interesting Patterns of Square Number
- Finding the Square of a Number
- Concept of Square Roots
- Finding Square Root Through Repeated Subtraction
- Finding Square Root Through Prime Factorisation
- Finding Square Root by Division Method
- Square Root of Decimal Numbers
- Estimating Square Root
Cubes and Cube Roots
Comparing Quantities
- Concept of Ratio
- Basic Concept of Percentage
- Increase Or Decrease as Percent
- Concept of Discount
- Estimation in Percentages
- Basic Concepts of Profit and Loss
- Sales Tax, Value Added Tax, and Good and Services Tax
- Calculation of Interest
- Concept of Compound Interest
- Deducing a Formula for Compound Interest
- Rate Compounded Annually Or Half Yearly (Semi Annually)
- Applications of Compound Interest Formula
Algebraic Expressions and Identities
- Algebraic Expressions
- Terms, Factors and Coefficients of Expression
- Types of Algebraic Expressions as Monomials, Binomials, Trinomials, and Polynomials
- Like and Unlike Terms
- Addition of Algebraic Expressions
- Subtraction of Algebraic Expressions
- Multiplication of Algebraic Expressions
- Multiplying Monomial by Monomials
- Multiplying a Monomial by a Binomial
- Multiplying a Monomial by a Trinomial
- Multiplying a Binomial by a Binomial
- Multiplying a Binomial by a Trinomial
- Concept of Identity
- Expansion of (a + b)2 = a2 + 2ab + b2
- Expansion of (a - b)2 = a2 - 2ab + b2
- Expansion of (a + b)(a - b) = a2-b2
- Expansion of (x + a)(x + b)
Mensuration
Visualizing Solid Shapes
Exponents and Powers
Direct and Inverse Proportions
Factorization
- Factors and Multiples
- Factorising Algebraic Expressions
- Factorisation by Taking Out Common Factors
- Factorisation by Regrouping Terms
- Factorisation Using Identities
- Factors of the Form (x + a)(x + b)
- Dividing a Monomial by a Monomial
- Dividing a Polynomial by a Monomial
- Dividing a Polynomial by a Polynomial
- Concept of Find the Error
Introduction to Graphs
- Concept of Bar Graph
- Interpretation of Bar Graphs
- Drawing a Bar Graph
- Concept of Double Bar Graph
- Interpretation of a Double Bar Graph
- Drawing a Double Bar Graph
- Concept of Pie Graph (Or a Circle-graph)
- Graphical Representation of Data as Histograms
- Concept of a Line Graph
- Linear Graphs
- Some Application of Linear Graphs
Playing with Numbers
Definition
Bar graph: A bar graph is a representation of numbers using bars of uniform width and the lengths of the bars depend upon the frequency and the scale you have chosen.
Notes
Graphical Representation of Data:
-
Data is represented graphically to give a clear idea of what it represents.
-
It is well said that one picture is better than a thousand words.
-
Usually, comparisons among the individual items are best shown by means of graphs.
-
The representation then becomes easier to understand than the actual data.
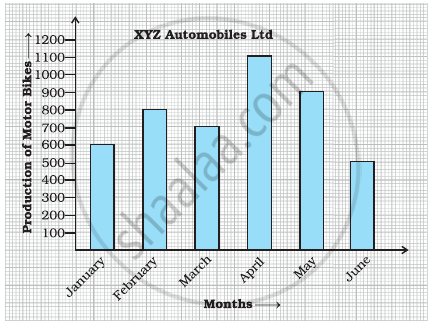
1. Bar Graph:
-
A bar graph is used to show a comparison among categories.
-
A bar graph is a representation of numbers using bars of uniform width and the lengths of the bars depend upon the frequency and the scale you have chosen.
-
A bar chart or bar graph is a chart or graph that presents categorical data with rectangular bars with heights or lengths proportional to the values that they represent.
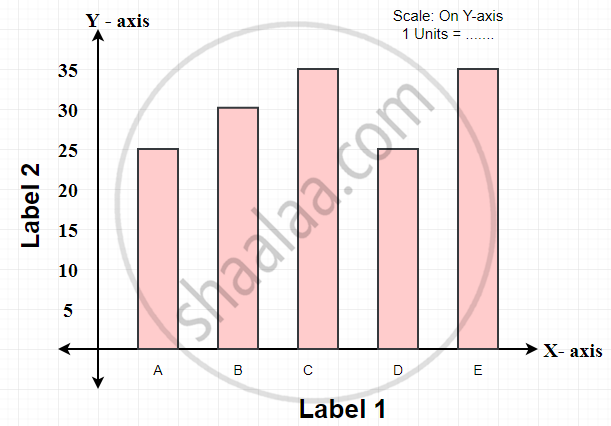
Choosing a Scale:
-
A bar graph is a representation of numbers using bars of uniform width and the lengths of the bars depend upon the frequency and the scale you have chosen.
-
Large numbers cannot be represented in a bar graph, so the scaling factor is used to reduce or scale down large numbers.
Parts of a Bar Graph:
-
Title: The title explains what the graph is about.
-
Scale: The scale of a bar graph is the range of values presented along either the horizontal or vertical axis. A bar graph is a representation of numbers using bars of uniform width and the lengths of the bars depend upon the frequency and the scale you have chosen. Large numbers cannot be represented in a bar graph, so the scaling factor is used to reduce or scale down large numbers.
-
Interval: Interval is the smallest quantity between two tick marks along an axis.
-
Labels: Both the side and the bottom of the bar graph have a label that tells what kind of data is shown. X-axis describes what each data point on the line represents and the y-axis shows the numeric value for each point on the line.
-
Bars: The bar measures the data number.
-
Key: Explains any additional information included in the graph. Many times, this will show different colors or symbols used to represent different categories. It is needed only when data about more than one category are shown in the graph.
-
Data values: Data values are the actual numbers for each data point.
Data is represented graphically to give a clear idea of what it represents.
It is well said that one picture is better than a thousand words.
Usually, comparisons among the individual items are best shown by means of graphs.
The representation then becomes easier to understand than the actual data.
-
A bar graph is used to show a comparison among categories.
-
A bar graph is a representation of numbers using bars of uniform width and the lengths of the bars depend upon the frequency and the scale you have chosen.
-
A bar chart or bar graph is a chart or graph that presents categorical data with rectangular bars with heights or lengths proportional to the values that they represent.
Choosing a Scale:
-
A bar graph is a representation of numbers using bars of uniform width and the lengths of the bars depend upon the frequency and the scale you have chosen.
-
Large numbers cannot be represented in a bar graph, so the scaling factor is used to reduce or scale down large numbers.
Parts of a Bar Graph:
-
Title: The title explains what the graph is about.
-
Scale: The scale of a bar graph is the range of values presented along either the horizontal or vertical axis. A bar graph is a representation of numbers using bars of uniform width and the lengths of the bars depend upon the frequency and the scale you have chosen. Large numbers cannot be represented in a bar graph, so the scaling factor is used to reduce or scale down large numbers.
-
Interval: Interval is the smallest quantity between two tick marks along an axis.
-
Labels: Both the side and the bottom of the bar graph have a label that tells what kind of data is shown. X-axis describes what each data point on the line represents and the y-axis shows the numeric value for each point on the line.
-
Bars: The bar measures the data number.
-
Key: Explains any additional information included in the graph. Many times, this will show different colors or symbols used to represent different categories. It is needed only when data about more than one category are shown in the graph.
-
Data values: Data values are the actual numbers for each data point.
Title: The title explains what the graph is about.
Scale: The scale of a bar graph is the range of values presented along either the horizontal or vertical axis. A bar graph is a representation of numbers using bars of uniform width and the lengths of the bars depend upon the frequency and the scale you have chosen. Large numbers cannot be represented in a bar graph, so the scaling factor is used to reduce or scale down large numbers.
Interval: Interval is the smallest quantity between two tick marks along an axis.
Labels: Both the side and the bottom of the bar graph have a label that tells what kind of data is shown. X-axis describes what each data point on the line represents and the y-axis shows the numeric value for each point on the line.
Bars: The bar measures the data number.
Key: Explains any additional information included in the graph. Many times, this will show different colors or symbols used to represent different categories. It is needed only when data about more than one category are shown in the graph.
Data values: Data values are the actual numbers for each data point.
Shaalaa.com | Selecting Right Scale
Series: Concept of Bar Graph
Related QuestionsVIEW ALL [61]
The following table shows the average intake of nutrients in calories by rural and urban groups in a particular year. Using a suitable scale for the given data, draw a double bar graph to compare the data.
| Foodstuff | Rural | Urban |
| Pulses | 35 | 49 |
| Leafy vegetables | 14 | 21 |
| Other vegetables | 51 | 89 |
| Fruits | 35 | 66 |
| Milk | 70 | 250 |
| Fish and flesh floods | 10 | 22 |
| Fats and Oils | 9 | 35 |
| Sugar/Jaggery | 19 | 31 |
The students of Class VII have to choose one club from Music, Dance, Yoga, Dramatics, Fine arts and Electronics clubs. The data given below shows the choices made by girls and boys of the class. Study the table and answer the questions that follow:
| Clubs | Music | Dance | Yoga | Dramatics | Fine Arts | Electronics |
| Girls | 15 | 24 | 10 | 19 | 27 | 21 |
| Boys | 12 | 16 | 8 | 17 | 11 | 30 |
- Draw a double bar graph using appropriate scale to depict the above data.
- How many students are there in Class VII?
- Which is the most preferred club by boys?
- Which is the least preferred club by girls?
- For which club the difference between boys and girls is the least?
- For which club is the difference between boys and girls the maximum?
The table below gives the data of tourists visiting 5 hill stations over two consecutive years. Study the table and answer the questions that follow:
| Hill stations | Nainital | Shimla | Manali | Mussoorie | Kullu |
| 2008 | 4000 | 5200 | 3700 | 5800 | 3500 |
| 2009 | 4800 | 4500 | 4200 | 6200 | 4600 |
- Draw a double bar graph to depict the above information using appropriate scale.
- Which hill station was visited by the maximum number of tourists in 2008?
- Which hill station was visited by the least number of tourists in 2009?
- In which hill stations was there increase in number of tourists in the year 2009?


The following chart gives the growth in height in terms of percentage of full height of boys and girls with their respective ages.
| Age (in years) | 8 | 9 | 10 | 11 | 12 | 13 | 14 | 15 | 16 | 17 |
18 |
| Boys | 72% | 75% | 78% | 81% | 84% | 88% | 92% | 95% | 98% | 99% | 100% |
| Girls | 77% | 81% | 84% | 88% | 91% | 95% | 98% | 99% | 99.5% | 100% | 100% |
Draw the line graph of above data on the same sheet and answer the following questions.
- In which year both the boys and the girls achieve their maximum height?
- Who grows faster at puberty (14 years to 16 years of age)?
