Advertisements
Advertisements
Question
Study the bar graph given below and answer the questions that follow:

- What information is depicted from the bar graph?
- In which subject is the student very good?
- Calculate the average marks of the student.
- If 75 and above marks denote a distinction, then name the subjects in which the student got distinction.
- Calculate the percentage of marks the student got out of 500.
Solution
a. The given bar graph shows marks obtained by a student in different subjects out of 100.
b. Subject in which student is very good, Maths as he scored highest marks, i.e. 82.
c. Average marks = `"Sum of all marks obtained in various subjects"/"Total subjects"`
= `(64 + 75 + 82 + 71 + 49)/5`
= `341/5`
= 68.2%
d. In Hindi and Maths, student got 75 and 82 marks, respectively. since, the Marks equal to 75 or above denote a distinction. Hence, student got distinction in Hindi and Maths.
e. Percentage marks = `"Total marks scored"/"Total marks" xx 100%`
= `341/500 xx 100%`
= 68.2%
APPEARS IN
RELATED QUESTIONS
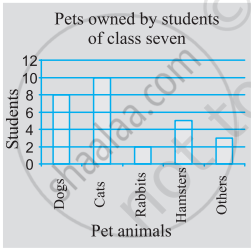
Use the bar graph (see the given figure) to answer the following question.

How many students have dog as a pet?
To represent the population of different towns using bar graph, it is convenient to take one unit length to represent one person.
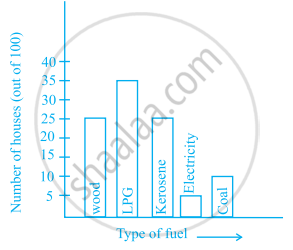
The following bar graph shows the number of houses (out of 100) in a town using different types of fuels for cooking.
Read the bar graph and answer the following questions:
Scale: 1 unit length = 5 houses
(a) Which fuel is used in maximum number of houses?
(b) How many houses are using coal as fuel?
(c) Suppose that the total number of houses in the town is 1 lakh.
From the above graph estimate the number of houses using electricity.
The lengths in km (rounded to nearest hundred) of some major rivers of India is given below
| River | Length (in km) |
| Narmada | 1300 |
| Mahanadi | 900 |
| Brahmputra | 2900 |
| Ganga | 2500 |
| Kaveri | 800 |
| Krishna | 1300 |
Draw a bar graph to represent the above information.
Number of mobile phone users in various age groups in a city is listed below:
| Age group (in years) | Number of mobile users |
| 1 – 20 | 25000 |
| 21 – 40 | 40000 |
| 41 – 50 | 35000 |
| 61 – 80 | 10000 |
Draw a bar graph to represent the above information.
______ can be used to compare two collections of data.
The representation of data with bars of uniform width is called ______.
Study the bar graph given below and answer the questions that follow.

- What information does the above bar graph represent?
- In which year was production the least?
- After which year was the maximum rise in the production?
- Find the average production of rice during the 5 years.
- Find difference of rice production between years 2006 and 2008.
The bar graph given below represents the circulation of newspapers (dailies) in a town in six languages (the figures are approximated to hundreds).

Study the bar graph and answer the following questions:
- Find the total number of newspapers read in Hindi, Punjabi, Urdu, Marathi and Tamil.
- Find the excess number of newspapers read in Hindi than those in English.
- Name the language in which the least number of newspapers are read.
- Write the total circulation of newspapers in the town.
Study the double bar graph and answer the questions that follow:

- What information does the double bar graph represent?
- Find the total number of boys in all sections of Class VII.
- In which sections, the number of girls is greater than the number of boys?
- In which section, the number of boys is the maximum?
- In which section, the number of girls is the least?
