Advertisements
Advertisements
Question
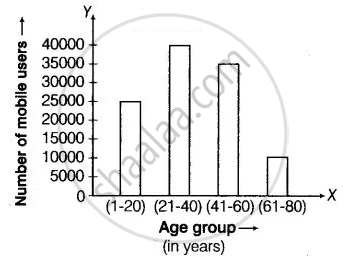
Number of mobile phone users in various age groups in a city is listed below:
| Age group (in years) | Number of mobile users |
| 1 – 20 | 25000 |
| 21 – 40 | 40000 |
| 41 – 50 | 35000 |
| 61 – 80 | 10000 |
Draw a bar graph to represent the above information.
Solution
In order to construct a bar graph representing the above data, we follow the following steps:
Step I: Take a graph paper and draw two mutually perpendicular lines OX and OY. Let OX as the horizontal axis and OY as the vertical axis.
Step II: Along OX, mark age groups and along OY, mark number of mobile users.
Step IV: Choose a suitable scale to determine the heights of the bars, according to the availability of space. Here, we choose 1 unit length represents 5000 mobile users.
Step V: Calculate the height of various bars as follows
| Age group (in years) | Number of mobile users |
| (1 – 20) years | `25000/5000` = 5 units |
| (21 – 40) years | `40000/5000` = 8 units |
| (41 – 50) years | `35000/5000` = 7 units |
| (61 – 80) years | `10000/5000` = 2 units |
Hence, the required bar graph of given data is shown below
Scale: 1 unit length = 5000 mobile users
APPEARS IN
RELATED QUESTIONS
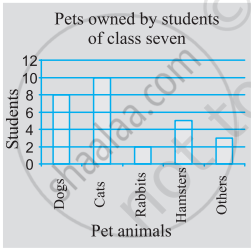
Use the bar graph (see the given figure) to answer the following question.

Which is the most popular pet?
Use the bar graph (see the given figure) to answer the following question.

How many students have dog as a pet?
In a bar graph, each bar (rectangle) represents only one value of the numerical data.
To represent the population of different towns using bar graph, it is convenient to take one unit length to represent one person.
The bar graph given below represents the circulation of newspapers in different languages in a town. Study the bar graph and answer the following questions:
Scale: 1 unit length = 200 Newspapers
(a) What is the circulation of English newspaper?
(b) Name the two languages in which circulation of newspaper is the same.
(c) By how much is the circulation of newspaper in Hindi more than the newspaper in Bengali?
The representation of data with bars of uniform width is called ______.
Study the bar graph given below and answer the questions that follow:

- What information is depicted from the bar graph?
- In which subject is the student very good?
- Calculate the average marks of the student.
- If 75 and above marks denote a distinction, then name the subjects in which the student got distinction.
- Calculate the percentage of marks the student got out of 500.
The bar graph given below represents the circulation of newspapers (dailies) in a town in six languages (the figures are approximated to hundreds).

Study the bar graph and answer the following questions:
- Find the total number of newspapers read in Hindi, Punjabi, Urdu, Marathi and Tamil.
- Find the excess number of newspapers read in Hindi than those in English.
- Name the language in which the least number of newspapers are read.
- Write the total circulation of newspapers in the town.
The marks out of 100 obtained by Kunal and Soni in the Half Yearly Examination are given below:
| Subjects | English | Hindi | Maths | Science | S. Science | Sanskirt |
| Kunal | 72 | 81 | 92 | 96 | 64 | 85 |
| Soni | 86 | 89 | 90 | 82 | 75 | 82 |
- Draw a double bar graph by choosing appropriate scale.
- Calculate the total percentage of marks obtained by Soni.
- Calculate the total percentage of marks obtained by Kunal.
- Compare the percentages of marks obtained by Kunal and Soni.
- In how many subjects did Soni get more marks than Kunal? Which are those subjects?
- Who got more marks in S. Science and what was the difference of marks?
- In which subject the difference of marks was maximum and by how much?
The table below gives the flavours of ice cream liked by children (boys and girls) of a society.
| Flavours | Vanilla | Chocolate | Strawberry | Mango | Butterscotch |
| Boys | 4 | 9 | 3 | 8 | 13 |
| Girls | 8 | 12 | 7 | 9 | 10 |
Study the table and answer the following questions:
- Draw a double bar graph using appropriate scale to represent the above information.
- Which flavour is liked the most by the boys?
- How many girls are there in all?
- How many children like chocolate flavour of ice cream?
- Find the ratio of children who like strawberry flavour to vanilla flavour of ice cream.
