Advertisements
Advertisements
Question
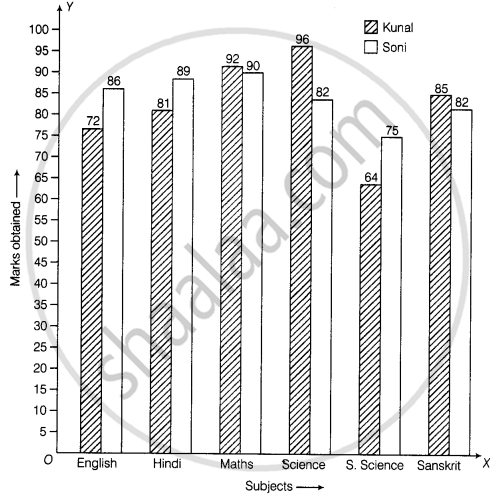
The marks out of 100 obtained by Kunal and Soni in the Half Yearly Examination are given below:
| Subjects | English | Hindi | Maths | Science | S. Science | Sanskirt |
| Kunal | 72 | 81 | 92 | 96 | 64 | 85 |
| Soni | 86 | 89 | 90 | 82 | 75 | 82 |
- Draw a double bar graph by choosing appropriate scale.
- Calculate the total percentage of marks obtained by Soni.
- Calculate the total percentage of marks obtained by Kunal.
- Compare the percentages of marks obtained by Kunal and Soni.
- In how many subjects did Soni get more marks than Kunal? Which are those subjects?
- Who got more marks in S. Science and what was the difference of marks?
- In which subject the difference of marks was maximum and by how much?
Solution
a. Steps to construct the bar graphs are as follows:
Step I: We draw two lines perpendicular to each other on a graph paper and call them horizontal and vertical axes.
Step II: Along the horizontal axis, OX mark the subjects and along vertical axis, OY mark the marks obtained.
Step III: We choose a suitable scale to determine the heights of bars. Here, we choose the scale as 1 small division to represent 5 marks.
Step IV: First, we draw the bars for Kunal and then bars for Soni for different years.
Bars for Kunal and Soni shaded separately and the shading is shown in the top right corner of the graph paper.

b. Total percentage of marks obtained by Soni
= `("Total marks obtained by Soni in six subjects"/600 xx 100)%`
= `((86 + 89 + 90 + 82 + 75 + 82)/600 xx 100)%`
= `(504/600 xx 100)%`
= 84%
c. Total percentage of marks obtained by Kunai
= `("Total marks obtained by Kunal in six subjects"/600 xx 100)%`
= `((72 + 81 + 92 + 96 + 64 + 85)/600 xx 100)%`
= `(490/600 xx 100)%`
= 81.6%
d. Ratio of percentage marks obtained by Kunal and Soni = 81.6:84 = 34:35
e. In English, Hindi and S.Science, Soni get more marks than Kunal.
f. Marks obtained by Kunal and Soni is S.Science are 64 and 75, respectively. Therefore, Soni got more marks than Kunal by 11 marks.
g. In English and Science, the difference of marks was maximum = (504 – 490), i.e. 14 marks.
APPEARS IN
RELATED QUESTIONS
The performance of students in 1st Term and 2nd Term is given. Draw a double bar graph choosing appropriate scale and answer the following:
| Subject | English | Hindi | Maths | Science | S. science |
| 1st Term (M.M. 100) | 67 | 72 | 88 | 81 | 73 |
| 2nd Term (M.M. 100) | 70 | 65 | 95 | 85 | 75 |
- In which subject, has the child improved his performance the most?
- In which subject is the improvement the least?
- Has the performance gone down in any subject?
Consider this data collected from a survey of a colony.
| Favourite sport | Cricket | Basket Ball | Swimming | Hockey | Athletics |
| Watching | 1240 | 470 | 510 | 430 | 250 |
| Participating | 620 | 320 | 320 | 250 | 105 |
- Draw a double bar graph choosing an appropriate scale. What do you infer from the bar graph?
- Which sport is most popular?
- Which is more preferred, watching or participating in sports?
In the table given below, the information is given about roads. Using this draw a sub-divided and percentage bar diagram (Approximate the percentages to the nearest integer).
| Year | Permanent Roads ( Lakh km.) |
Temporary Roads ( Lakh km.) |
| 2000-2001 | 14 | 10 |
| 2001-2002 | 15 | 11 |
| 2002-2003 | 17 | 13 |
| 2003-2004 | 20 | 19 |
In a bar graph, bars of uniform width are drawn vertically only.
To represent the population of different towns using bar graph, it is convenient to take one unit length to represent one person.
| Crop | Area of land (in million hectares) |
| Rice | 50 |
| Wheat | 30 |
| Pulses | 20 |
| Sugarcane | 25 |
| Cotton | 15 |
Prepare a bar graph of the data.
The representation of data with bars of uniform width is called ______.
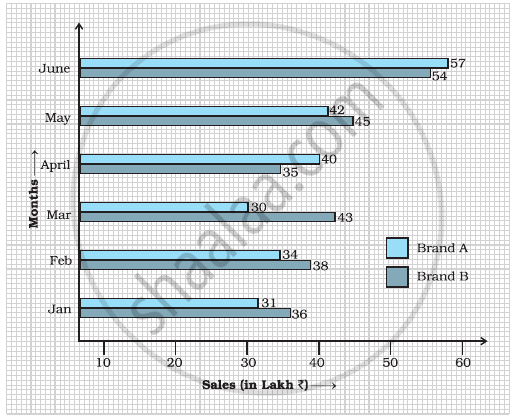
Study the double bar graph shown below and answer the questions that follow:

- What information is represented by the above double bar graph?
- In which month sales of Brand A decreased as compared to the previous month?
- What is the difference in sales of both the Brands for the month of June?
- Find the average sales of Brand B for the six months.
- List all months for which the sales of Brand B was less than that of Brand A.
- Find the ratio of sales of Brand A as compared to Brand B for the month of January.
Observe the following data:
| Government School, Chandpur | ||
| Daily Attendance | Date: 15.4.2009 | |
| Class | Total Students | Number of Students Present on that Day |
| VI | 90 | 81 |
| VII | 82 | 76 |
| VIII | 95 | 91 |
| IX | 70 | 65 |
| X | 63 | 62 |
- Draw a double bar graph choosing an appropriate scale. What do you infer from the bar graph?
- Which class has the maximum number of students?
- In which class, the difference of total students and number of students present is minimum?
- Find the ratio of number of students present to the total number of students of Class IX.
- What per cent of Class VI students were absent?
Observe the given data:
| Days of the week |
Mon | Tues | Wed | Thurs | Fri | Sat |
| Number of Mobile Phone Sets Sold |
50 | 45 | 30 | 55 | 27 | 60 |
- Draw a bar graph to represent the above given information.
- On which day of the week was the sales maximum?
- Find the total sales during the week.
- Find the ratio of the minimum sale to the maximum sale.
- Calculate the average sale during the week.
- On how many days of the week was the sale above the average sales?
