Advertisements
Advertisements
Question
| Crop | Area of land (in million hectares) |
| Rice | 50 |
| Wheat | 30 |
| Pulses | 20 |
| Sugarcane | 25 |
| Cotton | 15 |
Prepare a bar graph of the data.
Solution
Scale: 1 unit length = 5 million hectares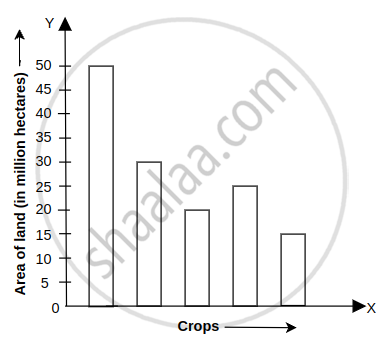
APPEARS IN
RELATED QUESTIONS
The following table shows the number of Buses and Trucks in nearest lakh units. Draw percentage bar-diagram. (Approximate the percentages to the nearest integer)
| Year | No. of Trucks | No. of Buses |
| 2006-2007 | 47 | 9 |
| 2007-2008 | 56 | 13 |
| 2008-2009 | 60 | 16 |
| 2009-2010 | 63 | 18 |
To represent the population of different towns using bar graph, it is convenient to take one unit length to represent one person.
Scale: 1 unit length = 200 km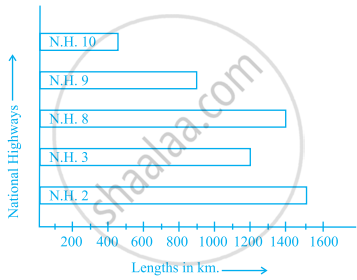
Prepare a pictograph of the data by taking a suitable symbol to represent 200 kilometers.
______ can be used to compare two collections of data.
Study the bar graph given below and answer the questions that follow:

- What information is depicted from the bar graph?
- In which subject is the student very good?
- Calculate the average marks of the student.
- If 75 and above marks denote a distinction, then name the subjects in which the student got distinction.
- Calculate the percentage of marks the student got out of 500.
The bar graph given below represents the circulation of newspapers (dailies) in a town in six languages (the figures are approximated to hundreds).

Study the bar graph and answer the following questions:
- Find the total number of newspapers read in Hindi, Punjabi, Urdu, Marathi and Tamil.
- Find the excess number of newspapers read in Hindi than those in English.
- Name the language in which the least number of newspapers are read.
- Write the total circulation of newspapers in the town.
Study the double bar graph given below and answer the questions that follow:

- What information is compared in the above given double bar graph?
- Calculate the ratio of minimum temperatures in the year 2008 to the year 2009 for the month of November.
- For how many months was the minimum temperature in the year 2008 greater than that of year 2009? Name those months.
- Find the average minimum temperature for the year 2008 for the four months.
- In which month is the variation in the two temperatures maximum?
The following table shows the average intake of nutrients in calories by rural and urban groups in a particular year. Using a suitable scale for the given data, draw a double bar graph to compare the data.
| Foodstuff | Rural | Urban |
| Pulses | 35 | 49 |
| Leafy vegetables | 14 | 21 |
| Other vegetables | 51 | 89 |
| Fruits | 35 | 66 |
| Milk | 70 | 250 |
| Fish and flesh floods | 10 | 22 |
| Fats and Oils | 9 | 35 |
| Sugar/Jaggery | 19 | 31 |
Study the double bar graph and answer the questions that follow:

- What information does the double bar graph represent?
- Find the total number of boys in all sections of Class VII.
- In which sections, the number of girls is greater than the number of boys?
- In which section, the number of boys is the maximum?
- In which section, the number of girls is the least?
The marks out of 100 obtained by Kunal and Soni in the Half Yearly Examination are given below:
| Subjects | English | Hindi | Maths | Science | S. Science | Sanskirt |
| Kunal | 72 | 81 | 92 | 96 | 64 | 85 |
| Soni | 86 | 89 | 90 | 82 | 75 | 82 |
- Draw a double bar graph by choosing appropriate scale.
- Calculate the total percentage of marks obtained by Soni.
- Calculate the total percentage of marks obtained by Kunal.
- Compare the percentages of marks obtained by Kunal and Soni.
- In how many subjects did Soni get more marks than Kunal? Which are those subjects?
- Who got more marks in S. Science and what was the difference of marks?
- In which subject the difference of marks was maximum and by how much?
