Advertisements
Advertisements
प्रश्न
| Crop | Area of land (in million hectares) |
| Rice | 50 |
| Wheat | 30 |
| Pulses | 20 |
| Sugarcane | 25 |
| Cotton | 15 |
Prepare a bar graph of the data.
उत्तर
Scale: 1 unit length = 5 million hectares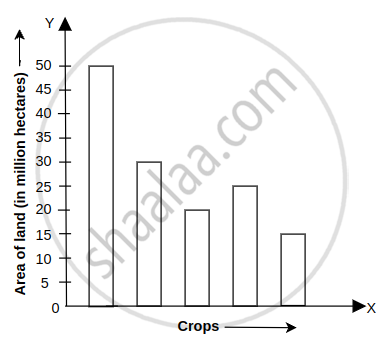
APPEARS IN
संबंधित प्रश्न
Use the bar graph (see the given figure) to answer the following question.
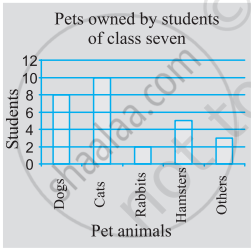
Which is the most popular pet?
In the table given below, the information is given about roads. Using this draw a sub-divided and percentage bar diagram (Approximate the percentages to the nearest integer).
| Year | Permanent Roads ( Lakh km.) |
Temporary Roads ( Lakh km.) |
| 2000-2001 | 14 | 10 |
| 2001-2002 | 15 | 11 |
| 2002-2003 | 17 | 13 |
| 2003-2004 | 20 | 19 |
Practice time: Afterschool
Ask 10 of your friends about what they like to do most after school.
| What they like to do after school |
Number of children |
| Watching TV | |
| Playing football | |
| Reading storybooks | |
The graph shows the maximum temperatures recorded for two consecutive weeks of a town. Study the graph and answer the questions that follow.

- What information is given by the two axes?
- In which week was the temperature higher on most of the days?
- On which day was the temperature same in both the weeks?
- On which day was the difference in temperatures the maximum for both the weeks?
- What were the temperatures for both the weeks on Thursday?
- On which day was the temperature 35°C for the first week?
- On which day was the temperature highest for the second week?
The following chart gives the growth in height in terms of percentage of full height of boys and girls with their respective ages.
| Age (in years) | 8 | 9 | 10 | 11 | 12 | 13 | 14 | 15 | 16 | 17 |
18 |
| Boys | 72% | 75% | 78% | 81% | 84% | 88% | 92% | 95% | 98% | 99% | 100% |
| Girls | 77% | 81% | 84% | 88% | 91% | 95% | 98% | 99% | 99.5% | 100% | 100% |
Draw the line graph of above data on the same sheet and answer the following questions.
- In which year both the boys and the girls achieve their maximum height?
- Who grows faster at puberty (14 years to 16 years of age)?
In a bar graph, each bar (rectangle) represents only one value of the numerical data.
The following bar graph represents the data for different sizes of shoes worn by the students in a school. Read the graph and answer the following questions.
Scale: 1 unit length = 50 students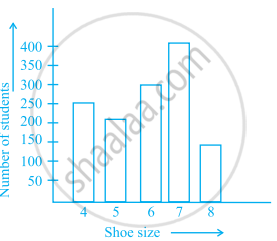
(a) Find the number of students whose shoe sizes have been collected.
(b) What is the number of students wearing shoe size 6?
(c) What are the different sizes of the shoes worn by the students?
(d) Which shoe size is worn by the maximum number of students?
(e) Which shoe size is worn by minimum number of students?
(f) State whether true or false:
The total number of students wearing shoe sizes 5 and 8 is the same as the number of students wearing shoe size 6.
The following graph gives the information about the number of railway tickets sold for different cities on a railway ticket counter between 6.00 am to 10.00 am. Read the bar graph and answer the following questions.
Scale: 1 unit length = 10 tickets
(a) How many tickets were sold in all?
(b) For which city were the maximum number of tickets sold?
(c) For which city were the minimum number of tickets sold?
(d) Name the cities for which the number of tickets sold is more than 20
(e) Fill in the blanks: Number of tickets sold for Delhi and Jaipur together exceeds the total number of tickets sold for Patna and Chennai by ______.
______ can be used to compare two collections of data.
Study the double bar graph shown below and answer the questions that follow:
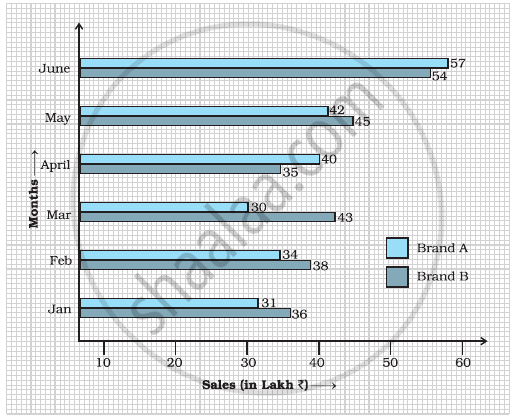
- What information is represented by the above double bar graph?
- In which month sales of Brand A decreased as compared to the previous month?
- What is the difference in sales of both the Brands for the month of June?
- Find the average sales of Brand B for the six months.
- List all months for which the sales of Brand B was less than that of Brand A.
- Find the ratio of sales of Brand A as compared to Brand B for the month of January.
