Advertisements
Advertisements
प्रश्न
______ can be used to compare two collections of data.
उत्तर
A double bar graph can be used to compare two collections of data.
APPEARS IN
संबंधित प्रश्न
The performance of students in 1st Term and 2nd Term is given. Draw a double bar graph choosing appropriate scale and answer the following:
| Subject | English | Hindi | Maths | Science | S. science |
| 1st Term (M.M. 100) | 67 | 72 | 88 | 81 | 73 |
| 2nd Term (M.M. 100) | 70 | 65 | 95 | 85 | 75 |
- In which subject, has the child improved his performance the most?
- In which subject is the improvement the least?
- Has the performance gone down in any subject?
Take the data giving the minimum and the maximum temperature of various cities given in the following table:
| Temperatures of the cities as on 20.6.2006 | ||
| City | Max. | Min. |
| Ahmedabad | 38ºC | 29ºC |
| Amritsar | 37ºC | 26ºC |
| Banglore | 28ºC | 21ºC |
| Chennai | 36ºC | 27ºC |
| Delhi | 38ºC | 28ºC |
| Jaipur | 39ºC | 29ºC |
| Jammu | 41ºC | 26ºC |
| Mumbai | 32ºC | 27ºC |
Plot a double bar graph using the data and answer the following:
- Which city has the largest difference in the minimum and maximum temperature on the given date?
- Which is the hottest city and which is the coldest city?
- Name two cities where maximum temperature of one was less than the minimum temperature of the other.
- Name the city which has the least difference between its minimum and the maximum temperature.
The graph given below shows the marks obtained out of 10 by Sonia in two different tests. Study the graph and answer the questions that follow.
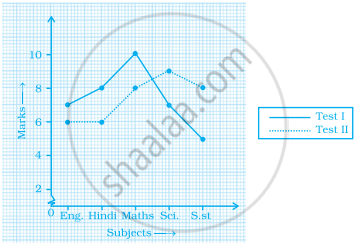
- What information is represented by the axes?
- In which subject did she score the highest in Test I?
- In which subject did she score the least in Test II?
- In which subject did she score the same marks in both the Tests?
- What are the marks scored by her in English in Test II?
- In which test was the performance better?
- In which subject and which test did she score full marks?
To represent the population of different towns using bar graph, it is convenient to take one unit length to represent one person.
In a bar graph, bars of ______ width can be drawn horizontally or vertically with ______ spacing between them.
The bar graph given below represents approximate length (in kilometres) of some National Highways in India. Study the bar graph and answer the following questions:
Scale: 1 unit length = 200 km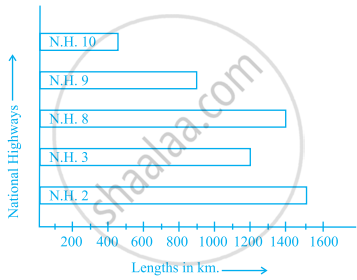
(a) Which National Highway (N.H.) is the longest among the above?
(b) Which National Highway is the shortest among the above?
(c) What is the length of National Highway 9?
(d) Length of which National Highway is about three times the National Highway10?
Number of mobile phone users in various age groups in a city is listed below:
| Age group (in years) | Number of mobile users |
| 1 – 20 | 25000 |
| 21 – 40 | 40000 |
| 41 – 50 | 35000 |
| 61 – 80 | 10000 |
Draw a bar graph to represent the above information.
The bar graph given below represents the circulation of newspapers (dailies) in a town in six languages (the figures are approximated to hundreds).

Study the bar graph and answer the following questions:
- Find the total number of newspapers read in Hindi, Punjabi, Urdu, Marathi and Tamil.
- Find the excess number of newspapers read in Hindi than those in English.
- Name the language in which the least number of newspapers are read.
- Write the total circulation of newspapers in the town.
The following table shows the average intake of nutrients in calories by rural and urban groups in a particular year. Using a suitable scale for the given data, draw a double bar graph to compare the data.
| Foodstuff | Rural | Urban |
| Pulses | 35 | 49 |
| Leafy vegetables | 14 | 21 |
| Other vegetables | 51 | 89 |
| Fruits | 35 | 66 |
| Milk | 70 | 250 |
| Fish and flesh floods | 10 | 22 |
| Fats and Oils | 9 | 35 |
| Sugar/Jaggery | 19 | 31 |
In a public library, the following observations were recorded by the librarian in a particular week:
| Days | Mon | Tues | Wed | Thurs | Fri | Sat |
| Newspaper Readers |
400 | 600 | 350 | 550 | 500 | 350 |
| Magazines Readers |
150 | 100 | 200 | 300 | 250 | 200 |
- Draw a double bar graph choosing an appropriate scale.
- On which day, the number of readers in the library was maximum?
- What is the mean number of magazine readers?
