Advertisements
Advertisements
प्रश्न
The representation of data with bars of uniform width is called ______.
उत्तर
The representation of data with bars of uniform width is called bar graph.
Explanation:
The representation of the data in the form of rectangles (bars) of uniform width is called a bar graph.
APPEARS IN
संबंधित प्रश्न
Use the bar graph (see the given figure) to answer the following question.
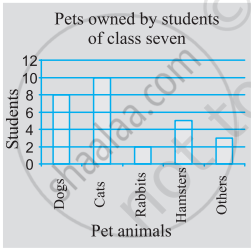
Which is the most popular pet?
The performance of students in 1st Term and 2nd Term is given. Draw a double bar graph choosing appropriate scale and answer the following:
| Subject | English | Hindi | Maths | Science | S. science |
| 1st Term (M.M. 100) | 67 | 72 | 88 | 81 | 73 |
| 2nd Term (M.M. 100) | 70 | 65 | 95 | 85 | 75 |
- In which subject, has the child improved his performance the most?
- In which subject is the improvement the least?
- Has the performance gone down in any subject?
The following table shows the number of Buses and Trucks in nearest lakh units. Draw percentage bar-diagram. (Approximate the percentages to the nearest integer)
| Year | No. of Trucks | No. of Buses |
| 2006-2007 | 47 | 9 |
| 2007-2008 | 56 | 13 |
| 2008-2009 | 60 | 16 |
| 2009-2010 | 63 | 18 |
The following table shows the number of Buses and Trucks in nearest lakh units. Draw percentage bar-diagram. (Approximate the percentages to the nearest integer)
| Year | No. of Trucks | No. of Buses |
| 2005-2006 | 47 | 9 |
| 2007-2008 | 56 | 13 |
| 2008-2009 | 60 | 16 |
| 2009-2010 | 63 | 18 |
The graph shows the maximum temperatures recorded for two consecutive weeks of a town. Study the graph and answer the questions that follow.

- What information is given by the two axes?
- In which week was the temperature higher on most of the days?
- On which day was the temperature same in both the weeks?
- On which day was the difference in temperatures the maximum for both the weeks?
- What were the temperatures for both the weeks on Thursday?
- On which day was the temperature 35°C for the first week?
- On which day was the temperature highest for the second week?
In a bar graph, bars of ______ width can be drawn horizontally or vertically with ______ spacing between them.
The following graph gives the information about the number of railway tickets sold for different cities on a railway ticket counter between 6.00 am to 10.00 am. Read the bar graph and answer the following questions.
Scale: 1 unit length = 10 tickets
(a) How many tickets were sold in all?
(b) For which city were the maximum number of tickets sold?
(c) For which city were the minimum number of tickets sold?
(d) Name the cities for which the number of tickets sold is more than 20
(e) Fill in the blanks: Number of tickets sold for Delhi and Jaipur together exceeds the total number of tickets sold for Patna and Chennai by ______.
Study the bar graph given below and answer the questions that follow.

- What information does the above bar graph represent?
- In which year was production the least?
- After which year was the maximum rise in the production?
- Find the average production of rice during the 5 years.
- Find difference of rice production between years 2006 and 2008.
The students of Class VII have to choose one club from Music, Dance, Yoga, Dramatics, Fine arts and Electronics clubs. The data given below shows the choices made by girls and boys of the class. Study the table and answer the questions that follow:
| Clubs | Music | Dance | Yoga | Dramatics | Fine Arts | Electronics |
| Girls | 15 | 24 | 10 | 19 | 27 | 21 |
| Boys | 12 | 16 | 8 | 17 | 11 | 30 |
- Draw a double bar graph using appropriate scale to depict the above data.
- How many students are there in Class VII?
- Which is the most preferred club by boys?
- Which is the least preferred club by girls?
- For which club the difference between boys and girls is the least?
- For which club is the difference between boys and girls the maximum?
The table below gives the flavours of ice cream liked by children (boys and girls) of a society.
| Flavours | Vanilla | Chocolate | Strawberry | Mango | Butterscotch |
| Boys | 4 | 9 | 3 | 8 | 13 |
| Girls | 8 | 12 | 7 | 9 | 10 |
Study the table and answer the following questions:
- Draw a double bar graph using appropriate scale to represent the above information.
- Which flavour is liked the most by the boys?
- How many girls are there in all?
- How many children like chocolate flavour of ice cream?
- Find the ratio of children who like strawberry flavour to vanilla flavour of ice cream.
