Advertisements
Advertisements
प्रश्न
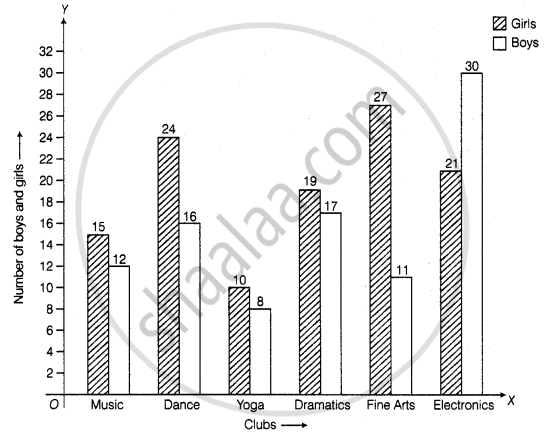
The students of Class VII have to choose one club from Music, Dance, Yoga, Dramatics, Fine arts and Electronics clubs. The data given below shows the choices made by girls and boys of the class. Study the table and answer the questions that follow:
| Clubs | Music | Dance | Yoga | Dramatics | Fine Arts | Electronics |
| Girls | 15 | 24 | 10 | 19 | 27 | 21 |
| Boys | 12 | 16 | 8 | 17 | 11 | 30 |
- Draw a double bar graph using appropriate scale to depict the above data.
- How many students are there in Class VII?
- Which is the most preferred club by boys?
- Which is the least preferred club by girls?
- For which club the difference between boys and girls is the least?
- For which club is the difference between boys and girls the maximum?
उत्तर
a. Steps to construct the bar graph are as follows:
Step I: We draw two lines perpendicular to each other on a graph paper and call them horizontal and vertical axes.
Step II: Along the horizontal axis, OX mark the clubs and along the vertical axis, OY mark the number of boys and girls.
Step III: We choose a suitable scale to determine the heights of bars.
Here, we choose the scale as 1 small division to represent 2.
Step IV: First, we draw the bars for girls and then bars for boys for different years. Bars for girls and boys are shaded separately and the shading is shown in the top right corner of the graph paper
b. Total students in class VII
= 15 + 12 + 24 + 16 + 10 + 8 + 19 + 17 + 27 + 11 + 21 + 30
= 210
c. From the given data, we can say that most preferred club by boys is Electronics.
d. From the given data, we can say that least preferred club by girls is Yoga.
e. It is clear from the given data in Yoga and Dramatics, the difference between boys and girls is the least, i.e. (19 – 17) = 2
f. It is clear from the given data in Fine Arts the difference between boys and girls is maximum, i.e. (27 – 11) = 16
APPEARS IN
संबंधित प्रश्न
The performance of students in 1st Term and 2nd Term is given. Draw a double bar graph choosing appropriate scale and answer the following:
| Subject | English | Hindi | Maths | Science | S. science |
| 1st Term (M.M. 100) | 67 | 72 | 88 | 81 | 73 |
| 2nd Term (M.M. 100) | 70 | 65 | 95 | 85 | 75 |
- In which subject, has the child improved his performance the most?
- In which subject is the improvement the least?
- Has the performance gone down in any subject?
The following chart gives the growth in height in terms of percentage of full height of boys and girls with their respective ages.
| Age (in years) | 8 | 9 | 10 | 11 | 12 | 13 | 14 | 15 | 16 | 17 |
18 |
| Boys | 72% | 75% | 78% | 81% | 84% | 88% | 92% | 95% | 98% | 99% | 100% |
| Girls | 77% | 81% | 84% | 88% | 91% | 95% | 98% | 99% | 99.5% | 100% | 100% |
Draw the line graph of above data on the same sheet and answer the following questions.
- In which year both the boys and the girls achieve their maximum height?
- Who grows faster at puberty (14 years to 16 years of age)?
The bar graph given below represents approximate length (in kilometres) of some National Highways in India. Study the bar graph and answer the following questions:
Scale: 1 unit length = 200 km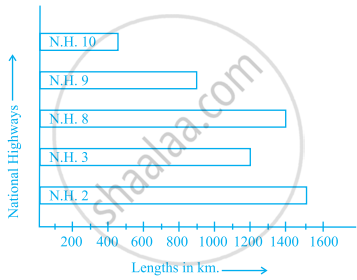
(a) Which National Highway (N.H.) is the longest among the above?
(b) Which National Highway is the shortest among the above?
(c) What is the length of National Highway 9?
(d) Length of which National Highway is about three times the National Highway10?
Read the bar graph given below and answer the following questions:
Scale: 1 unit = 50 students
(a) What information is given by the bar graph?
(b) In which year is the number of students maximum?
(c) In which year is the number of students twice as that of 2001 – 02?
(d) In which year did the number of students decrease as compared to previous year?
(e) In which year is the increase in number of students maximum as compared to the previous year?
The bar graph given below shows the marks of students of a class in a particular subject:

Study the bar graph and answer the following questions:
- If 40 is the pass mark, then how many students have failed?
- How many students got marks from 50 to 69?
- How many students scored 90 marks and above?
- If students who scored marks above 80 are given merits then how many merit holders are there?
- What is the strength of the class?
Study the double bar graph shown below and answer the questions that follow:
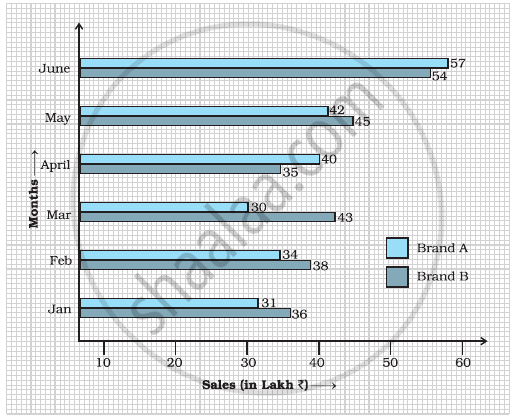
- What information is represented by the above double bar graph?
- In which month sales of Brand A decreased as compared to the previous month?
- What is the difference in sales of both the Brands for the month of June?
- Find the average sales of Brand B for the six months.
- List all months for which the sales of Brand B was less than that of Brand A.
- Find the ratio of sales of Brand A as compared to Brand B for the month of January.
Study the double bar graph given below and answer the questions that follow:

- What information is compared in the above given double bar graph?
- Calculate the ratio of minimum temperatures in the year 2008 to the year 2009 for the month of November.
- For how many months was the minimum temperature in the year 2008 greater than that of year 2009? Name those months.
- Find the average minimum temperature for the year 2008 for the four months.
- In which month is the variation in the two temperatures maximum?
Observe the following data:
| Government School, Chandpur | ||
| Daily Attendance | Date: 15.4.2009 | |
| Class | Total Students | Number of Students Present on that Day |
| VI | 90 | 81 |
| VII | 82 | 76 |
| VIII | 95 | 91 |
| IX | 70 | 65 |
| X | 63 | 62 |
- Draw a double bar graph choosing an appropriate scale. What do you infer from the bar graph?
- Which class has the maximum number of students?
- In which class, the difference of total students and number of students present is minimum?
- Find the ratio of number of students present to the total number of students of Class IX.
- What per cent of Class VI students were absent?
Observe the given data:
| Days of the week |
Mon | Tues | Wed | Thurs | Fri | Sat |
| Number of Mobile Phone Sets Sold |
50 | 45 | 30 | 55 | 27 | 60 |
- Draw a bar graph to represent the above given information.
- On which day of the week was the sales maximum?
- Find the total sales during the week.
- Find the ratio of the minimum sale to the maximum sale.
- Calculate the average sale during the week.
- On how many days of the week was the sale above the average sales?
Below is a list of 10 tallest buildings in India.
This list ranks buildings in India that stand at least 150 m (492 ft.) tall, based on standard height measurement. This includes spires and architectural details but does not include antenna marks. Following data is given as per the available information till 2009. Since new buildings are always under construction, go on-line to check new taller buildings.
Use the information given in the table about sky scrapers to answer the following questions:
| Name | City | Height | Floors | Year |
| Planet | Mumbai | 181 m | 51 | 2009 |
| UB Tower | Bengaluru | 184 m | 20 | 2006 |
| Ashok Towers | Mumbai | 193 m | 49 | 2009 |
| The Imperial I | Mumbai | 249 m | 60 | 2009 |
| The Imperial II | Mumbai | 249 m | 60 | 2009 |
| RNA Mirage | Mumbai | 180 m | 40 | 2009 |
| Oberoi Woods Tower I | Mumbai | 170 m | 40 | 2009 |
| Oberoi Woods Tower II | Mumbai | 170 m | 40 | 2009 |
| Oberoi Woods Tower III | Mumbai | 170 m | 40 | 2009 |
| MVRDC | Mumbai | 156 m | 35 | 2002 |
(a) Find the height of each storey of the three tallest buildings and write them in the following table:
| Building | Height | Number of storeys | Height of each storey |
(b) The average height of one storey for the buildings given in (a) is ______.
(c) Which city in this list has the largest percentage of skyscrapers? What is the percentage?
(d) What is the range of data?
(e) Find the median of the data.
(f) Draw a bar graph for given data.
